
 Nasdaq
 华尔街日报
华尔街日报Has Norfolk Southern’s 2025 Rally Outpaced Fundamentals After Safety and Efficiency Initiatives?
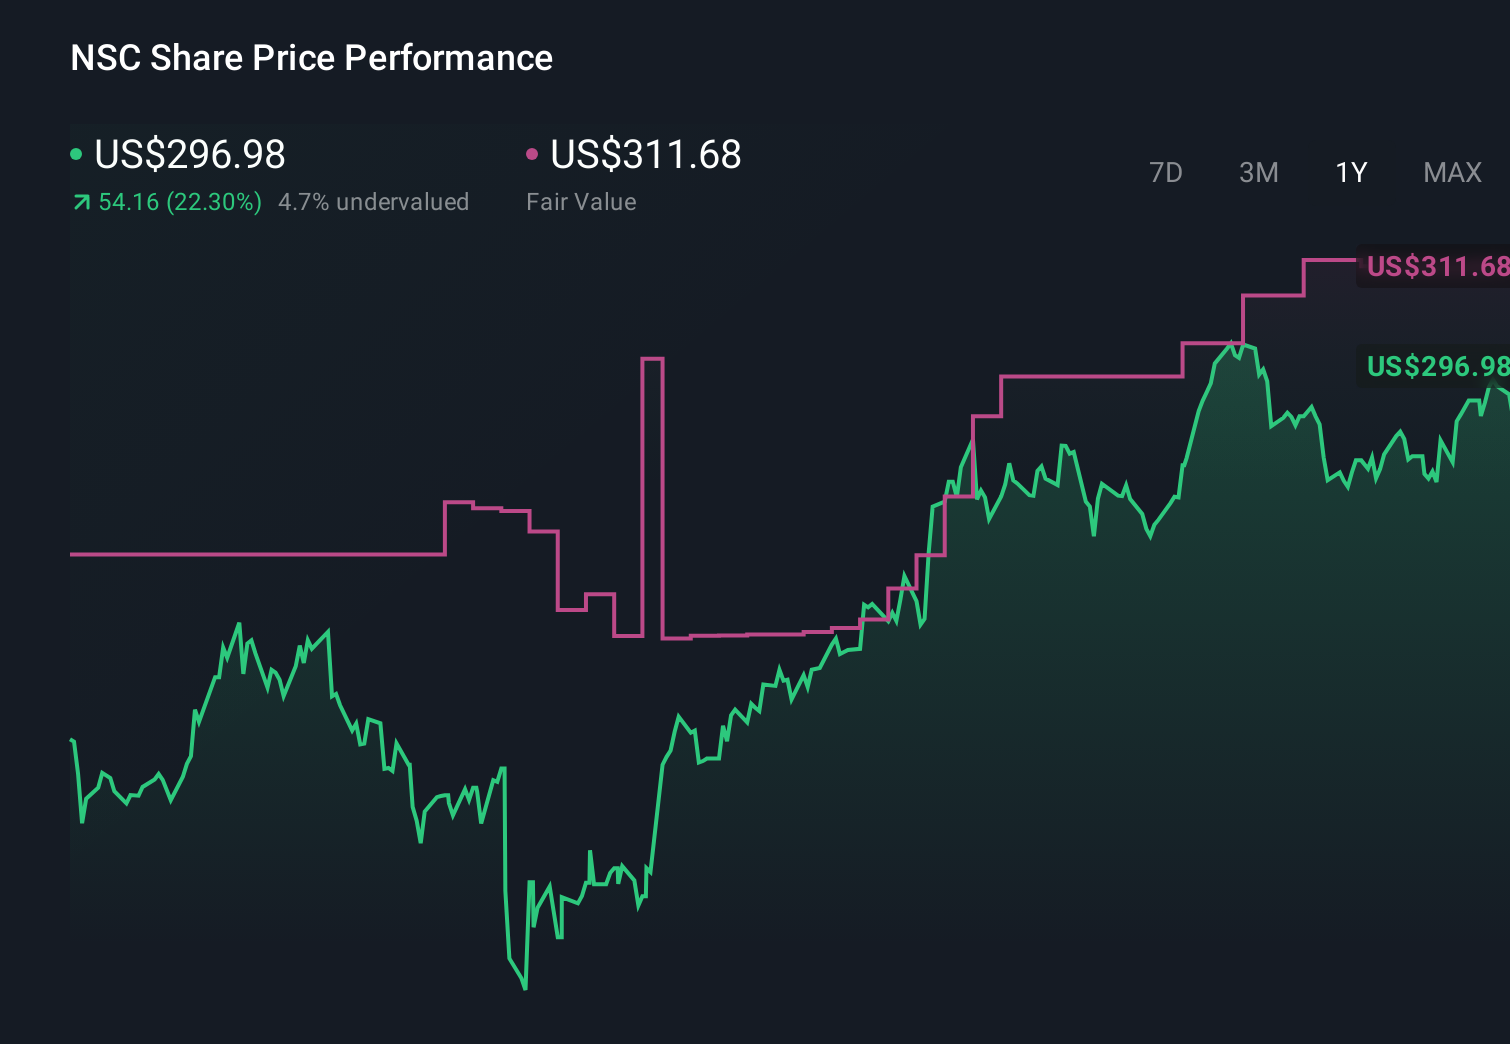
- If you are wondering whether Norfolk Southern at around $291 a share is still worth climbing aboard or if the train has already left the station, this piece is for you.
- The stock is up 24.2% year to date and 27.1% over the last year, even after a recent 1.9% dip this week and a 3.4% gain over the past month. This hints that the market is still actively reassessing its long term prospects.
- Recent headlines have focused on Norfolk Southern’s ongoing safety and network efficiency initiatives, alongside multi year capital plans aimed at upgrading infrastructure and improving service reliability. At the same time, regulatory scrutiny and operational changes across the U.S. rail industry have kept investor attention firmly on how these strategic moves could reshape costs and long term growth.
- Despite all that, Norfolk Southern only scores a 2 out of 6 on our valuation checks. We will look at what traditional valuation methods say about the stock and then finish with a more nuanced way to judge whether it is truly good value.
Norfolk Southern scores just 2/6 on our valuation checks. See what other red flags we found in the full valuation breakdown.
Approach 1: Norfolk Southern Discounted Cash Flow (DCF) Analysis
A Discounted Cash Flow, or DCF, model estimates what a company is worth by projecting its future cash flows and then discounting them back to today’s value using an appropriate rate of return.
For Norfolk Southern, Simply Wall St’s 2 Stage Free Cash Flow to Equity model starts with last twelve months Free Cash Flow of about $1.41 billion and incorporates analyst forecasts for the next few years, then extrapolates further out. Under this approach, Norfolk Southern’s Free Cash Flow is projected to rise to roughly $2.80 billion by 2029, with additional growth assumed through 2035 based on gradually moderating growth rates.
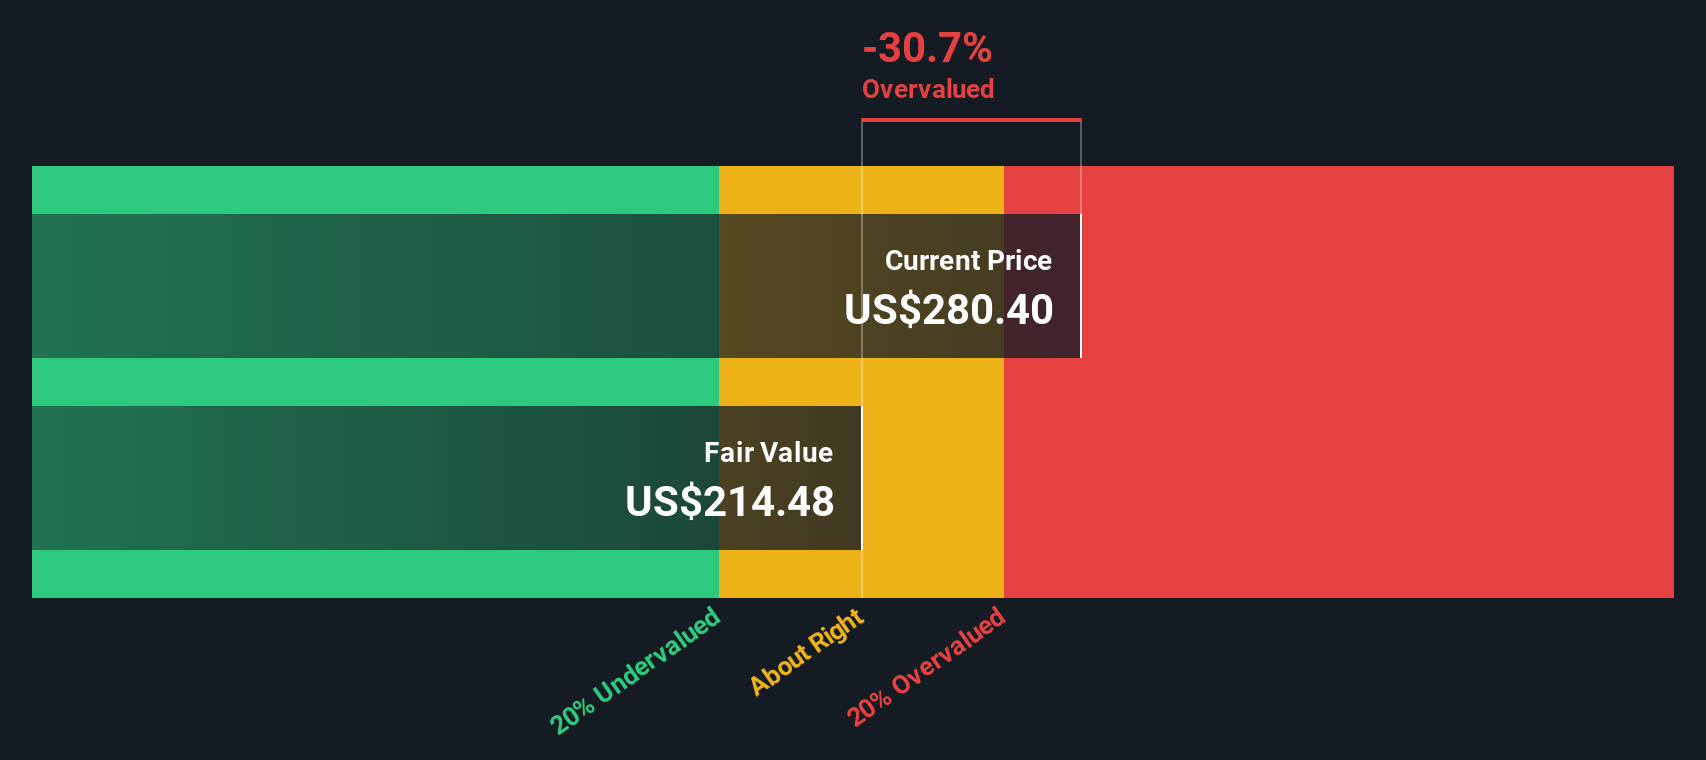
When all those future cash flows are discounted back to today, the model arrives at an estimated intrinsic value of about $218 per share. With the current share price around $291, the DCF suggests the stock is trading at roughly a 33.6% premium to this cash flow outlook.
Result: OVERVALUED
Our Discounted Cash Flow (DCF) analysis suggests Norfolk Southern may be overvalued by 33.6%. Discover 913 undervalued stocks or create your own screener to find better value opportunities.
Approach 2: Norfolk Southern Price vs Earnings
For profitable companies like Norfolk Southern, the Price to Earnings, or PE, ratio is a practical way to gauge whether investors are paying a reasonable price for each dollar of current earnings. What counts as a normal or fair PE depends on how quickly earnings are expected to grow and how risky those earnings are, with higher growth and lower risk generally justifying a higher multiple.
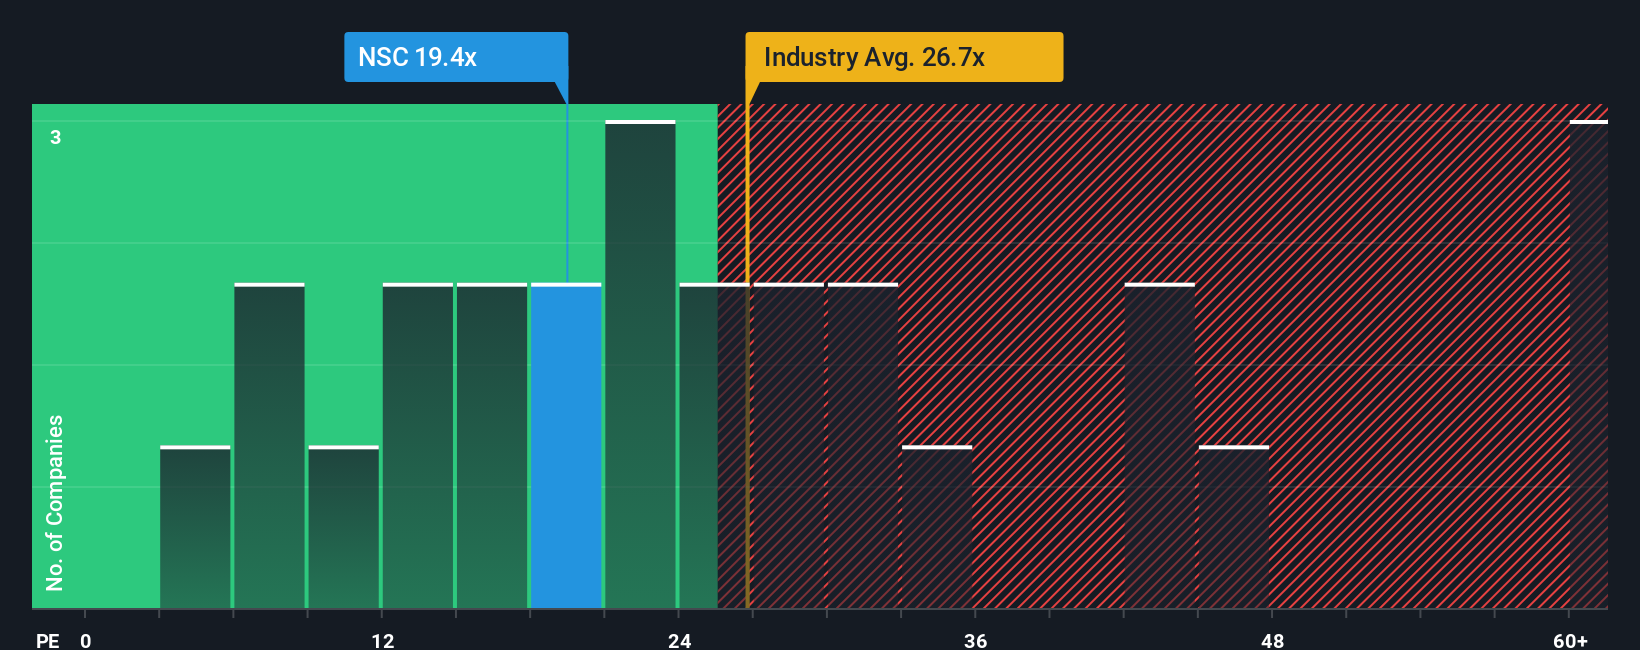
Norfolk Southern currently trades on a PE of about 22.1x. That is slightly below its peer group average of roughly 22.5x and well below the broader Transportation industry average of around 31.1x. At first glance, this can make the shares look relatively restrained.
Simply Wall St’s Fair Ratio for Norfolk Southern is 18.1x. This is the PE level the stock might trade on after accounting for its specific earnings growth outlook, risk profile, profit margins, industry, and market capitalization. This Fair Ratio is more tailored than a simple peer or industry comparison because it adjusts for the company’s own fundamentals rather than assuming all rail or transport stocks deserve the same valuation. Comparing the Fair Ratio of 18.1x with the current PE of 22.1x suggests the market is pricing Norfolk Southern somewhat above what its fundamentals alone would imply.
Result: OVERVALUED
PE ratios tell one story, but what if the real opportunity lies elsewhere? Discover 1463 companies where insiders are betting big on explosive growth.
Upgrade Your Decision Making: Choose your Norfolk Southern Narrative
Earlier we mentioned that there is an even better way to understand valuation, so let us introduce you to Narratives, a simple way for you to attach a clear story about Norfolk Southern’s future to your own numbers for revenue, earnings, margins, and fair value. You can then compare that fair value to today’s share price to help you decide whether to buy, hold, or sell.
A Narrative on Simply Wall St’s Community page turns your view of the company, such as confidence in PSR 2.0 efficiencies, merger outcomes, or freight demand, into a structured forecast that links the business story to a financial model and an explicit fair value estimate. All of this sits inside a tool used by millions of investors and is automatically updated as new news or earnings arrive.
For example, one Norfolk Southern Narrative might be more bullish, assuming the merger is approved, EPS compounds strongly and justifies a fair value closer to the higher end of recent analyst targets around $339. A more cautious Narrative could focus on regulatory risk, softer volumes, and margin pressure, pointing to a fair value nearer the low end of about $235. The spread between each Narrative’s fair value and the live share price then helps each investor judge whether the stock still looks attractive or already fully priced.
Do you think there's more to the story for Norfolk Southern? Head over to our Community to see what others are saying!
This article by Simply Wall St is general in nature. We provide commentary based on historical data and analyst forecasts only using an unbiased methodology and our articles are not intended to be financial advice. It does not constitute a recommendation to buy or sell any stock, and does not take account of your objectives, or your financial situation. We aim to bring you long-term focused analysis driven by fundamental data. Note that our analysis may not factor in the latest price-sensitive company announcements or qualitative material. Simply Wall St has no position in any stocks mentioned.
Have feedback on this article? Concerned about the content? Get in touch with us directly. Alternatively, email editorial-team@simplywallst.com