
 Nasdaq
 华尔街日报
华尔街日报Is Netflix’s Big Run And Paid Sharing Crackdown Still Justified By Its Valuation In 2025?
- Wondering if Netflix is still worth buying after its big run over the last few years, or if the easy money has already been made? You are not alone. That is exactly what this breakdown is here to unpack.
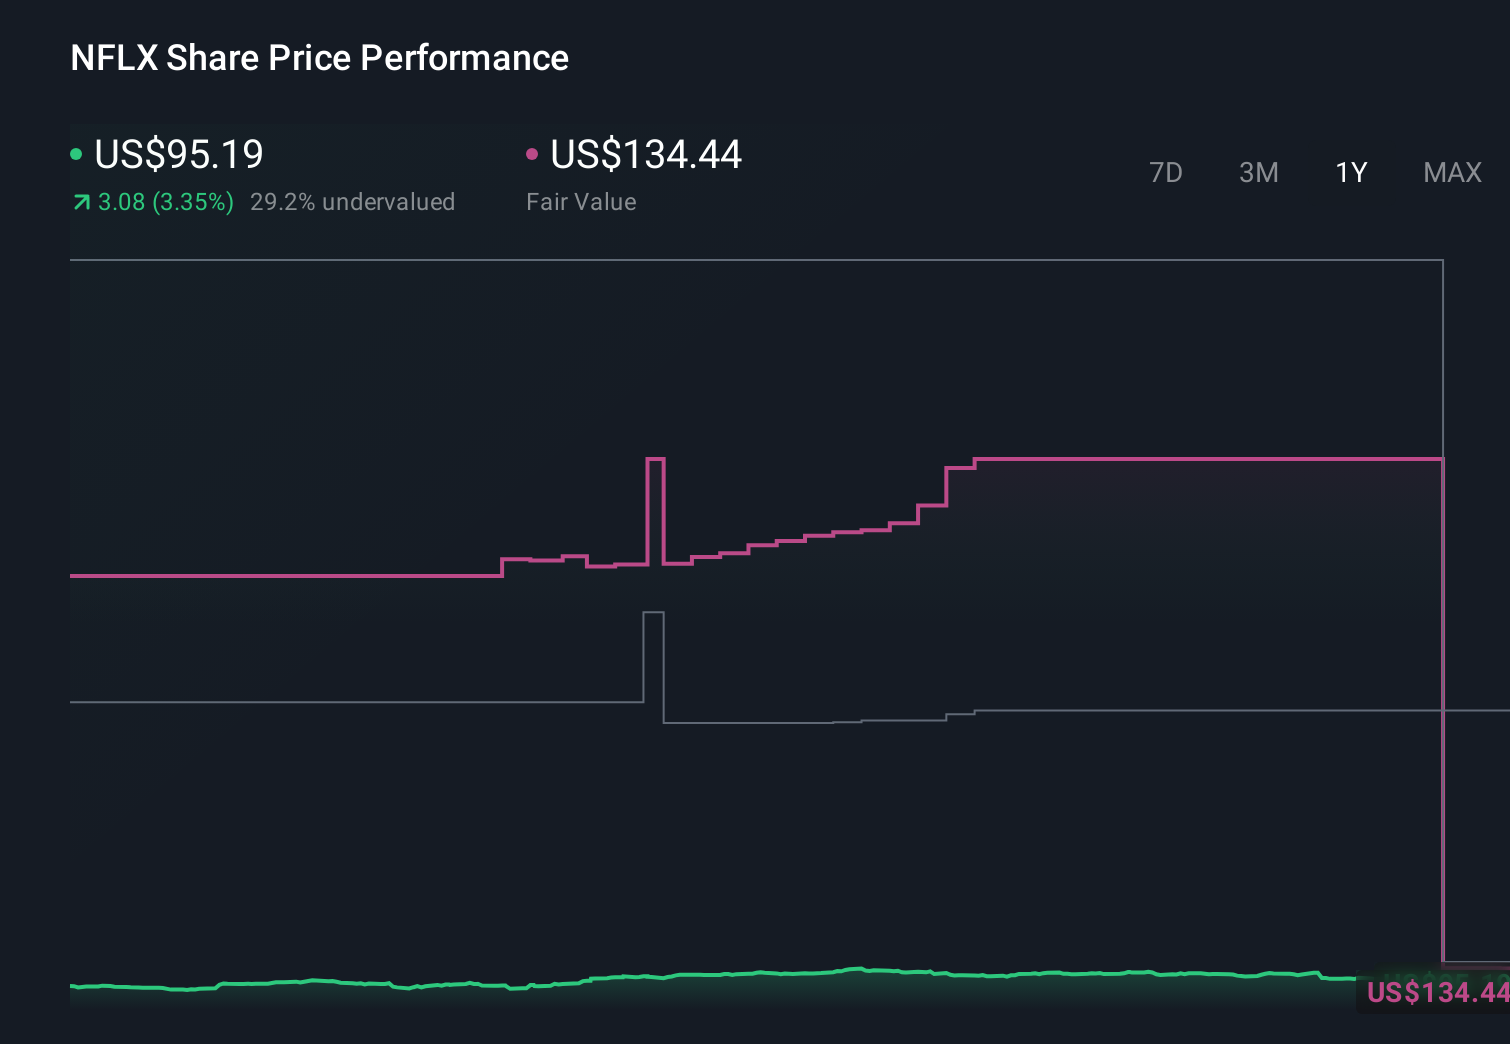
- Despite a powerful 220.0% gain over 3 years and 83.6% over 5 years, the stock has cooled recently, with a 6.4% year to date rise, 3.8% over the last year, but a softer -14.2% in the last month and -0.8% over the last week. This hints at shifting sentiment and a more nuanced risk reward profile.
- Recent headlines have focused on Netflix doubling down on paid sharing crackdowns and ad supported tiers, alongside expanding into gaming and live events, all aimed at squeezing more value from its 260M plus subscriber base. At the same time, chatter about intensifying competition from Disney, Amazon and a resurgent bundle trend has kept debate alive over how durable Netflix's long term growth story really is.
- Right now, Netflix only scores 1 out of 6 on our undervaluation checks. This suggests that on traditional metrics the stock is not screamingly cheap. However, there are several ways to look at what "fair value" really means and we will walk through those methods next, before finishing with a more intuitive way to think about valuation that ties the numbers back to Netflix's shifting narrative.
Netflix scores just 1/6 on our valuation checks. See what other red flags we found in the full valuation breakdown.
Approach 1: Netflix Discounted Cash Flow (DCF) Analysis
A Discounted Cash Flow model estimates what a company is worth by projecting its future cash flows and then discounting them back to today, to reflect risk and the time value of money.
For Netflix, the model uses last twelve months free cash flow of about $9.1 billion as a starting point, then builds on analyst forecasts and longer term extrapolations. Analysts expect free cash flow to climb into the low to mid teens of billions of dollars over the next few years, with Simply Wall St extending that trajectory so projected free cash flow reaches roughly $31.0 billion by 2035. All of these cash flows are converted into today’s dollars using a 2 Stage Free Cash Flow to Equity framework.
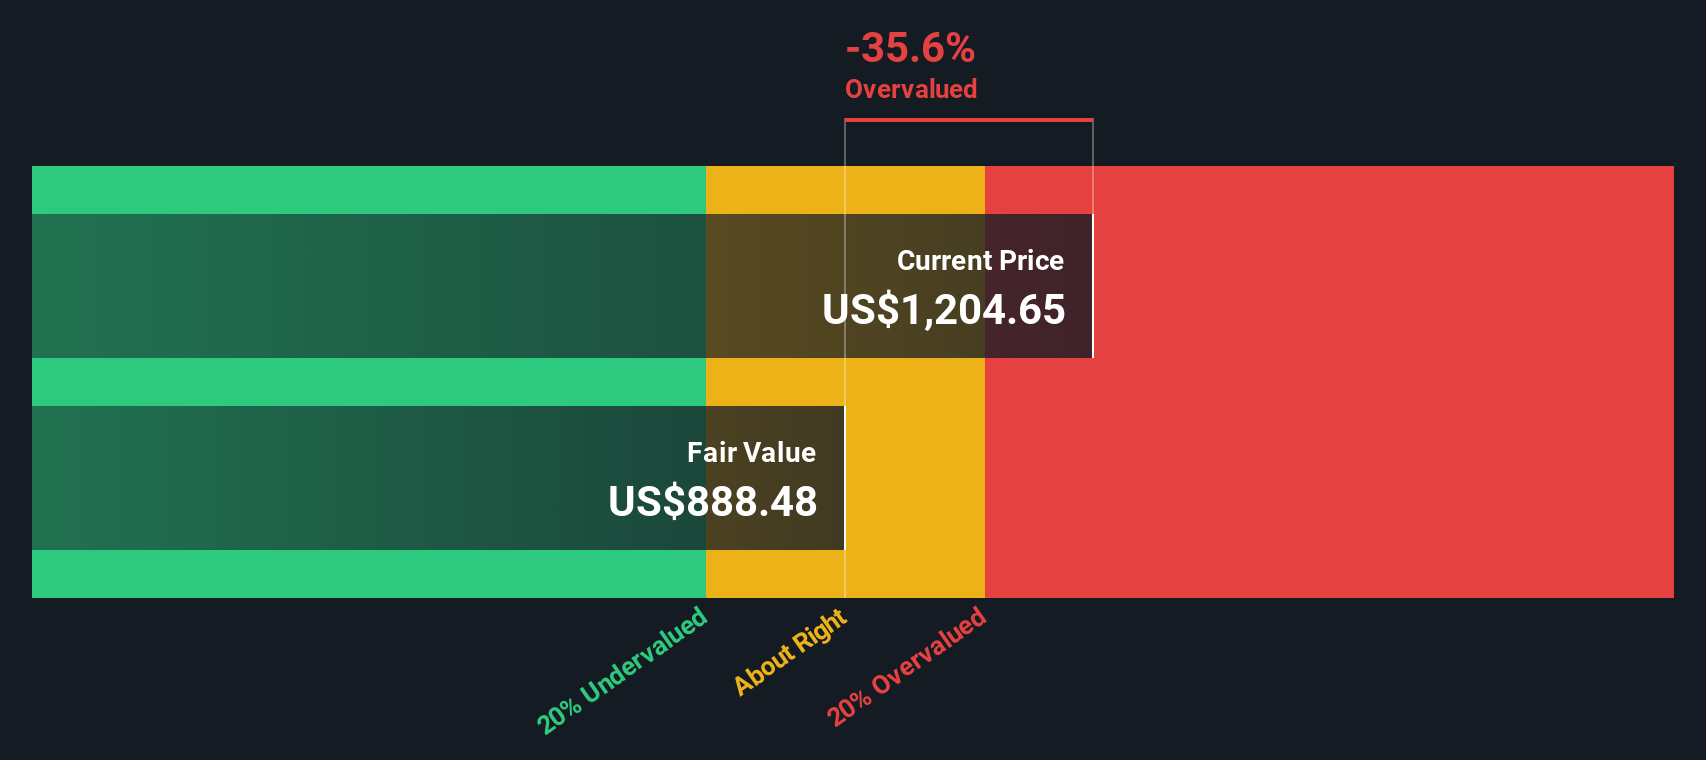
On this basis, the intrinsic value comes out at about $80.40 per share. Compared with the current share price, the DCF implies Netflix is roughly 17.4% overvalued, suggesting the market is already pricing in a lot of future success.
Result: OVERVALUED
Our Discounted Cash Flow (DCF) analysis suggests Netflix may be overvalued by 17.4%. Discover 913 undervalued stocks or create your own screener to find better value opportunities.
Approach 2: Netflix Price vs Earnings
For a profitable, relatively mature business like Netflix, the price to earnings (P/E) ratio is a useful way to judge valuation because it directly links what investors pay today to the profits the company is generating right now.
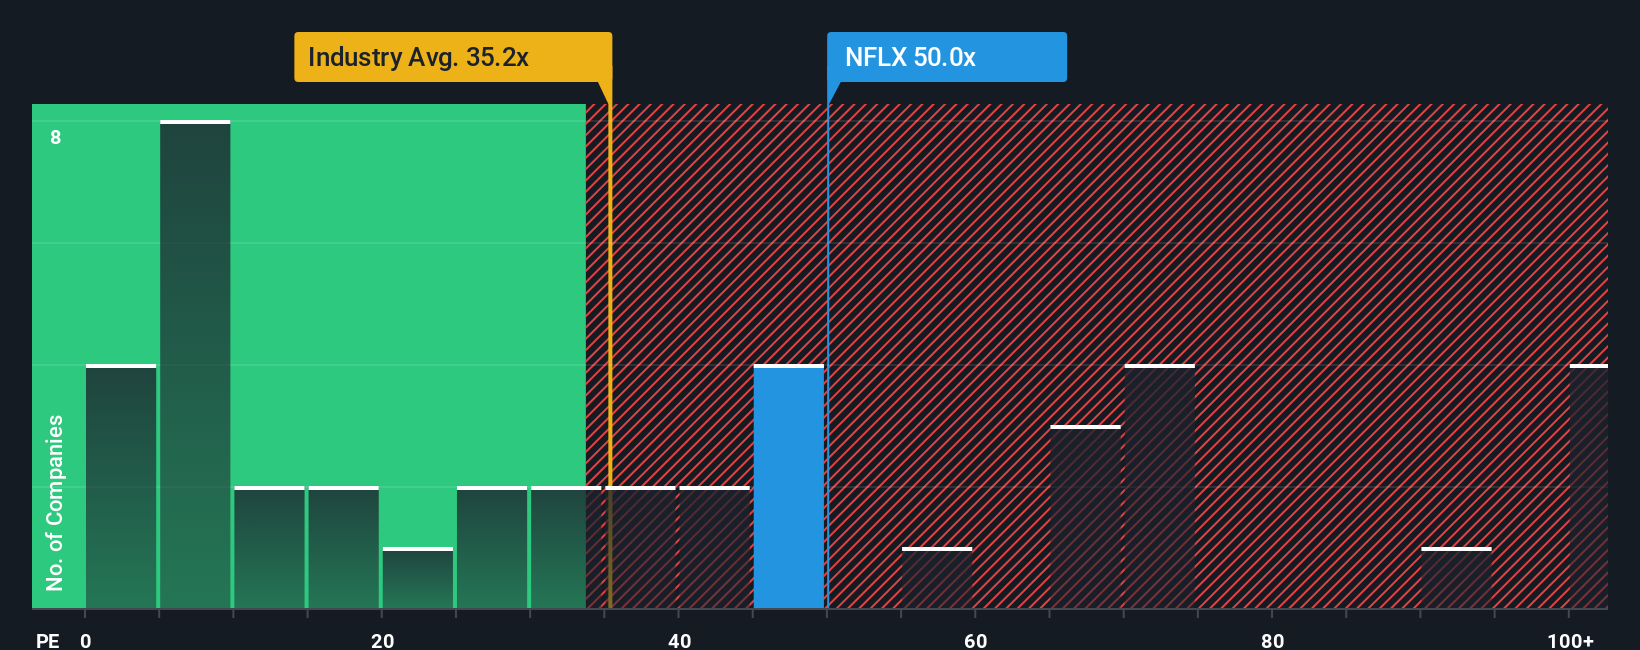
In general, faster earnings growth and lower perceived risk justify a higher P/E, while slower growth or more uncertainty argue for a lower, more conservative multiple. With Netflix, investors are paying 41.35x current earnings, which is roughly double the broader Entertainment industry average of 20.50x and still well below the peer group’s lofty 82.86x.
Simply Wall St’s Fair Ratio metric estimates what a reasonable P/E should be once you factor in Netflix’s earnings growth outlook, industry, profit margins, size and specific risks. This makes it more tailored than a simple comparison against peers or the industry, which can be distorted by outliers or very different business models. For Netflix, the Fair Ratio is 33.19x, noticeably below the current 41.35x, which implies that the market is still paying a premium that is not fully supported by its fundamentals.
Result: OVERVALUED
PE ratios tell one story, but what if the real opportunity lies elsewhere? Discover 1463 companies where insiders are betting big on explosive growth.
Upgrade Your Decision Making: Choose your Netflix Narrative
Earlier we mentioned that there is an even better way to understand valuation. Let us introduce you to Narratives, a simple framework on Simply Wall St’s Community page that lets you connect your view of Netflix’s story to specific forecasts for its future revenue, earnings and margins. This turns that story into a Fair Value you can compare to today’s Price to help decide when to buy or sell. The platform automatically updates your Narrative as new news or earnings arrive. One investor might build a more cautious Netflix Narrative that points to Fair Value closer to the lower end of recent targets, say around $750 per share. Another investor with a more optimistic view on ad tech, content leadership and margins might land nearer the top, closer to $1,600. Both can immediately see if their personal Fair Value is above or below the current price and what that implies for their next move.
Do you think there's more to the story for Netflix? Head over to our Community to see what others are saying!
This article by Simply Wall St is general in nature. We provide commentary based on historical data and analyst forecasts only using an unbiased methodology and our articles are not intended to be financial advice. It does not constitute a recommendation to buy or sell any stock, and does not take account of your objectives, or your financial situation. We aim to bring you long-term focused analysis driven by fundamental data. Note that our analysis may not factor in the latest price-sensitive company announcements or qualitative material. Simply Wall St has no position in any stocks mentioned.
Have feedback on this article? Concerned about the content? Get in touch with us directly. Alternatively, email editorial-team@simplywallst.com