
 Nasdaq
 华尔街日报
华尔街日报Sumitomo Realty & Development (TSE:8830): Valuation Check After Mumbai Rental Pivot and 2-for-1 Stock Split
Sumitomo Realty & Development (TSE:8830) just doubled down on its India pivot by pairing a 2 for 1 stock split with a long term push into Mumbai rentals, especially high end projects in Bandra Kurla Complex.
See our latest analysis for Sumitomo Realty & Development.
Those shifts are landing against powerful momentum, with a roughly 63 percent year to date share price return and a 70 percent one year total shareholder return suggesting investors are steadily warming to Sumitomo’s second growth engine story.
If this India expansion has you thinking bigger about real estate and beyond, it could be worth scanning fast growing stocks with high insider ownership for other under the radar growth stories with aligned insiders.
Yet with the stock trading above analyst targets despite only modest earnings growth, investors now face a harder question: Is Sumitomo still a mispriced India growth play, or has the market already factored in its next leg higher?
Price to Earnings of 18.6x: Is it justified?
On a trailing price to earnings ratio of 18.6 times at a last close of ¥8,031, Sumitomo Realty & Development screens as expensive versus peers.
The price to earnings multiple compares the current share price to per share earnings. This is a useful lens for a mature, profitable real estate operator with stable cash flows. For Sumitomo, this ratio encapsulates investor expectations for steady profit expansion rather than hyper growth, and offers a quick benchmark against both its own history and other Japanese property names.
Relative to the wider Japan real estate industry average of 11.5 times earnings and a peer group average of 14.8 times, the stock carries a clear valuation premium. This implies the market is willing to pay up for its quality earnings profile and accelerating profit trend. Yet our fair price to earnings estimate of 19 times suggests that while the stock looks rich against the sector today, the multiple is not wildly out of line with what fundamentals could justify if execution continues.
Explore the SWS fair ratio for Sumitomo Realty & Development
Result: Price to Earnings of 18.6x (OVERVALUED)
However, a stretched valuation and only mid single digit earnings growth leave little margin of safety if India execution stumbles or Japan’s property cycle turns.
Find out about the key risks to this Sumitomo Realty & Development narrative.
Another Take on Value
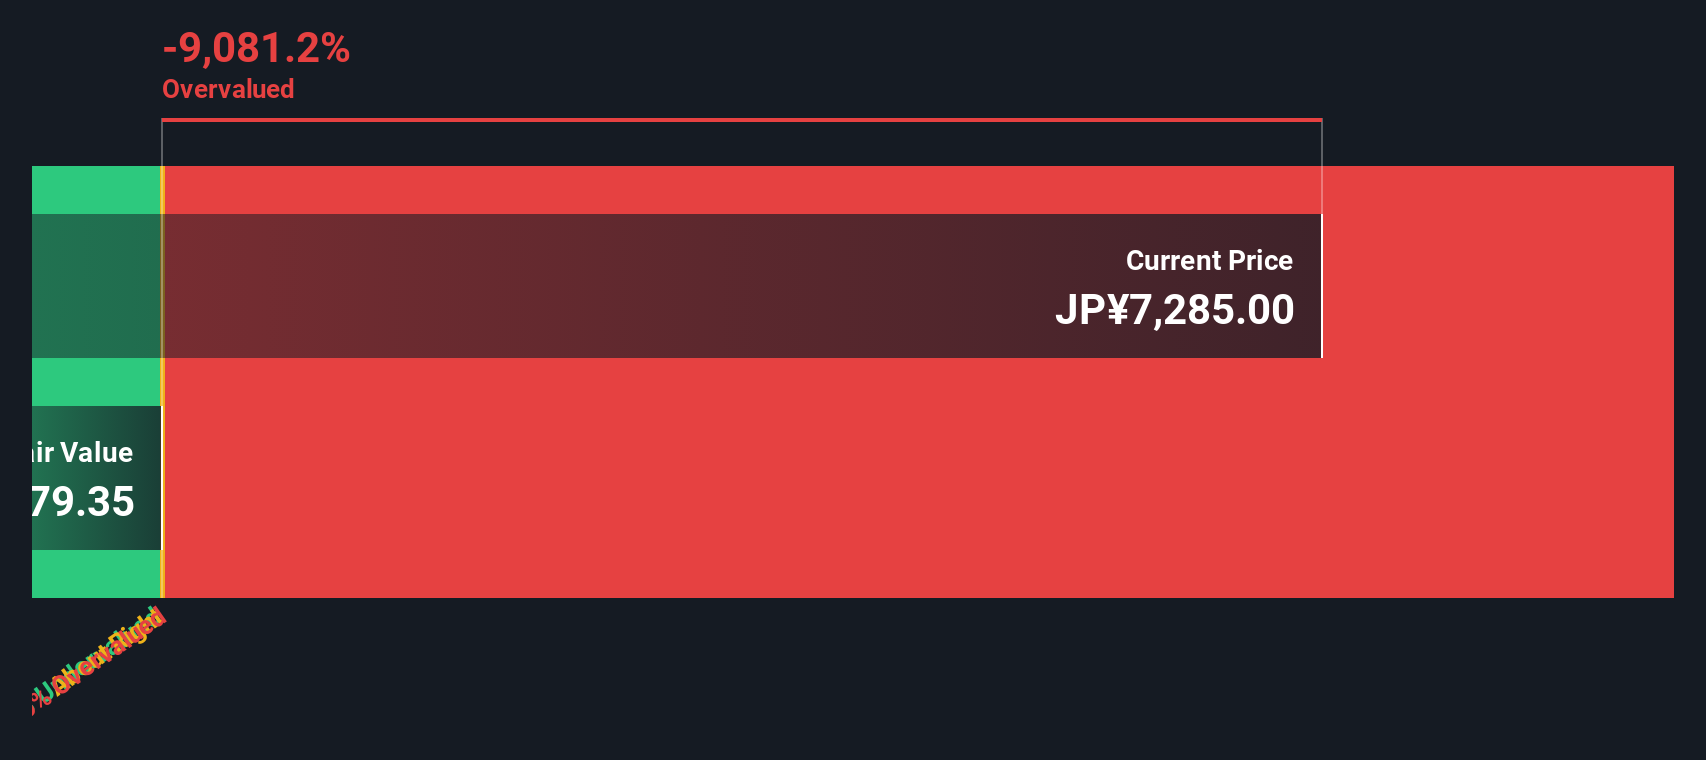
Our DCF model tells a very different story, pointing to a fair value of about ¥240 per share versus today’s ¥8,031. That gap suggests the current India optimism might be running ahead of long term cash flow reality, or it raises the question of whether the model is missing something significant.
Look into how the SWS DCF model arrives at its fair value.
Simply Wall St performs a discounted cash flow (DCF) on every stock in the world every day (check out Sumitomo Realty & Development for example). We show the entire calculation in full. You can track the result in your watchlist or portfolio and be alerted when this changes, or use our stock screener to discover 914 undervalued stocks based on their cash flows. If you save a screener we even alert you when new companies match - so you never miss a potential opportunity.
Build Your Own Sumitomo Realty & Development Narrative
If our view does not quite align with yours and you would rather dig into the numbers yourself, you can shape a custom take in minutes, Do it your way.
A great starting point for your Sumitomo Realty & Development research is our analysis highlighting 2 key rewards and 1 important warning sign that could impact your investment decision.
Ready for your next investing move?
Do not stop at one opportunity, use the Simply Wall St Screener to quickly uncover fresh stock ideas that fit your strategy before the market wakes up.
- Capture potential early stage momentum by scanning these 3625 penny stocks with strong financials that already show financial resilience instead of chasing hype after prices run.
- Position your portfolio at the intersection of healthcare and technology by reviewing these 29 healthcare AI stocks shaping the next wave of medical innovation.
- Strengthen your income stream by targeting these 13 dividend stocks with yields > 3% that balance attractive yields with sustainable payout potential.
This article by Simply Wall St is general in nature. We provide commentary based on historical data and analyst forecasts only using an unbiased methodology and our articles are not intended to be financial advice. It does not constitute a recommendation to buy or sell any stock, and does not take account of your objectives, or your financial situation. We aim to bring you long-term focused analysis driven by fundamental data. Note that our analysis may not factor in the latest price-sensitive company announcements or qualitative material. Simply Wall St has no position in any stocks mentioned.
Have feedback on this article? Concerned about the content? Get in touch with us directly. Alternatively, email editorial-team@simplywallst.com