
 Nasdaq
 华尔街日报
华尔街日报Is Intel’s 2025 AI and Foundry Pivot Enough After an 82% Share Price Surge?
- If you have been wondering whether Intel is still a bargain after its huge rebound, you are not alone. This article is going to unpack exactly what the current price is really offering.
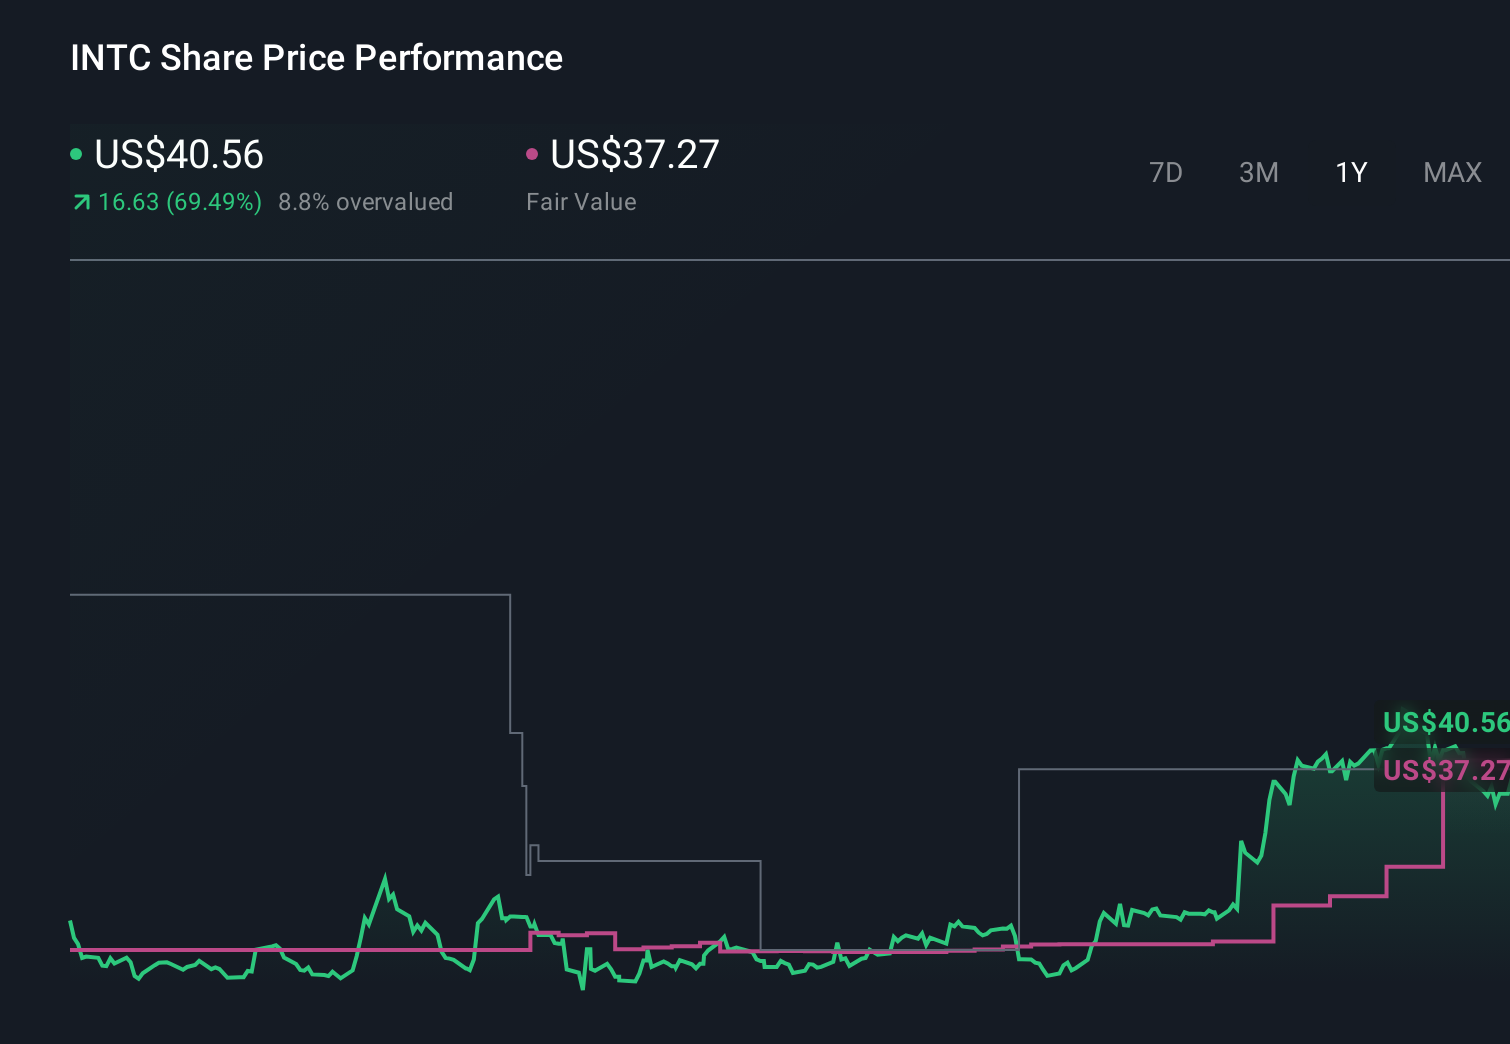
- After a rocky few years, Intel's share price has surged, up 82.1% year to date and 88.6% over the last year, even though it pulled back about 2.6% over the past week.
- Part of this renewed interest comes from Intel pushing aggressively into foundry services to compete with TSMC and seeking major government support for US and European chip manufacturing. Investors are also watching closely as the company positions itself in AI infrastructure and advanced process technologies, which has helped reset expectations around its long term growth prospects.
- Right now, Intel scores a 3 out of 6 on our valuation checks, suggesting it looks undervalued on some measures but not across the board. In the next sections we will break down different valuation approaches and finish with a more holistic way to think about what the stock is truly worth.
Approach 1: Intel Discounted Cash Flow (DCF) Analysis
A Discounted Cash Flow model estimates what a company is worth by projecting its future cash flows and discounting them back to today, using a required rate of return. For Intel, the model used is a 2 Stage Free Cash Flow to Equity approach based on cash flow projections.
Intel currently has trailing twelve month free cash flow of roughly negative $13.7 Billion, reflecting heavy investment and pressure on near term profitability. Analyst and extrapolated forecasts see this swinging back into positive territory, with free cash flow expected to reach about $10.9 Billion in 2035 as new capacity ramps and margins normalize.
When Simply Wall St discounts these projected cash flows back to today in dollars, the resulting intrinsic value comes out to roughly $14.71 per share. Compared with the current market price, this implies Intel is about 150.3% above the model's fair value. On this basis the stock screens as clearly overvalued rather than a deep value opportunity.
Result: OVERVALUED
Our Discounted Cash Flow (DCF) analysis suggests Intel may be overvalued by 150.3%. Discover 914 undervalued stocks or create your own screener to find better value opportunities.
Approach 2: Intel Price vs Sales
For companies like Intel that are reinvesting heavily and have volatile earnings, the price to sales ratio is often a cleaner way to value the business because sales are more stable than profits in the short term. What investors are really judging is how much they are willing to pay for each dollar of revenue, based on growth prospects and risk.
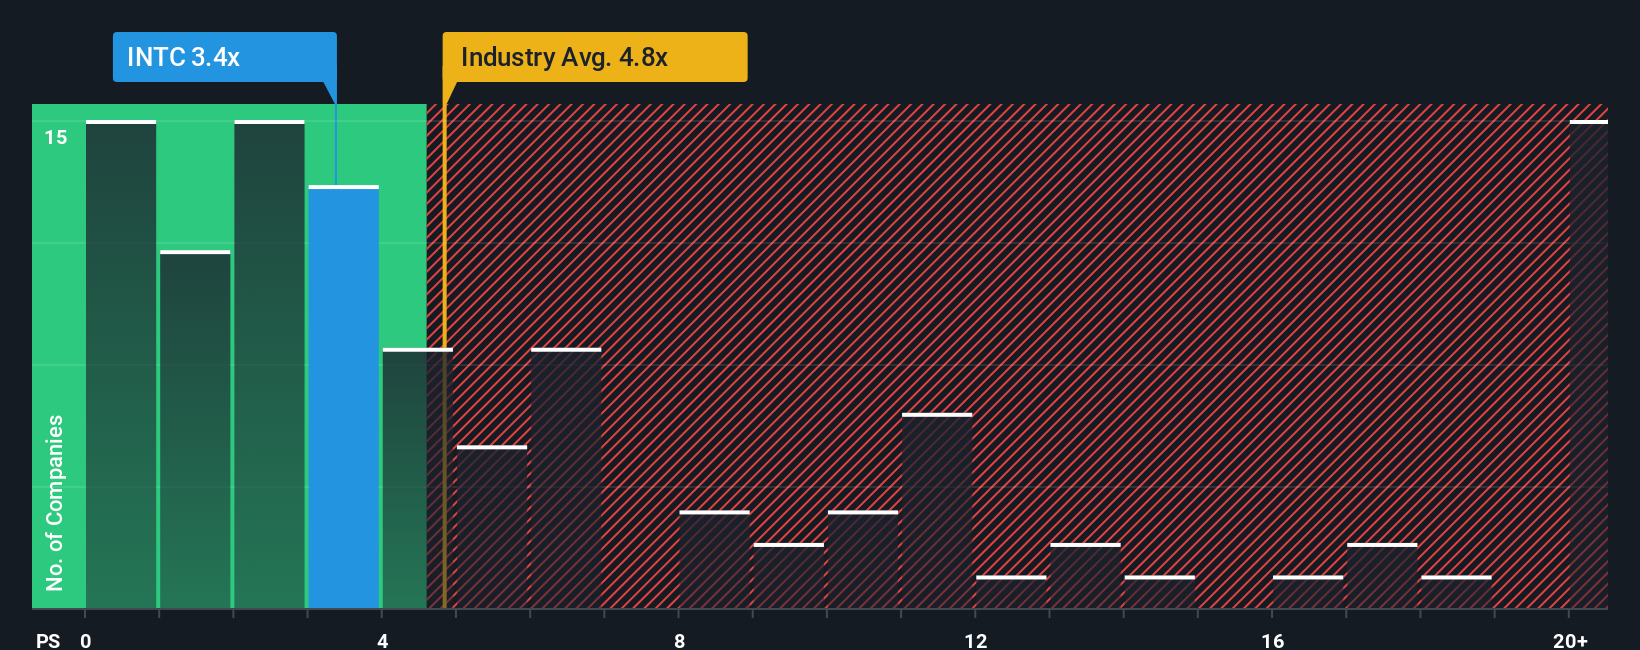
Right now Intel trades on a price to sales multiple of about 3.29x. This is below both the Semiconductor industry average of roughly 5.33x and the wider peer group average of around 13.28x. To go a step further, Simply Wall St estimates a proprietary Fair Ratio of 5.34x. This is the price to sales multiple Intel might reasonably command once its growth outlook, margins, industry position, market cap and risk profile are all taken into account. This firm specific yardstick is more informative than a simple peer or industry comparison because it adjusts for Intel’s own fundamentals rather than assuming it should look like the average chip company.
Comparing Intel’s current 3.29x to the 5.34x Fair Ratio suggests the stock screens as undervalued on a sales basis.
Result: UNDERVALUED
PS ratios tell one story, but what if the real opportunity lies elsewhere? Discover 1465 companies where insiders are betting big on explosive growth.
Upgrade Your Decision Making: Choose your Intel Narrative
Earlier we mentioned that there is an even better way to understand valuation, so let us introduce you to Narratives, a simple way to give a story to your numbers by tying your view of Intel’s future revenue, earnings and margins directly to an assumed fair value per share. A Narrative is your own structured perspective on a company, where you spell out what you think will actually happen in the business, translate that into a financial forecast, and from there into a fair value that you can compare to today’s share price to decide whether to buy, hold or sell. Narratives on Simply Wall St, available to millions of investors through the Community page, are easy to create and update, and they automatically refresh when new information like earnings, guidance or major news is released. For Intel, one investor might see a bullish AI and foundry led turnaround and arrive at a fair value around the high 20s per share, while a more cautious investor, focused on execution and margin risks, might anchor closer to the mid teens, and both perspectives are captured as live Narratives that evolve over time.
For Intel however we will make it really easy for you with previews of two leading Intel Narratives:
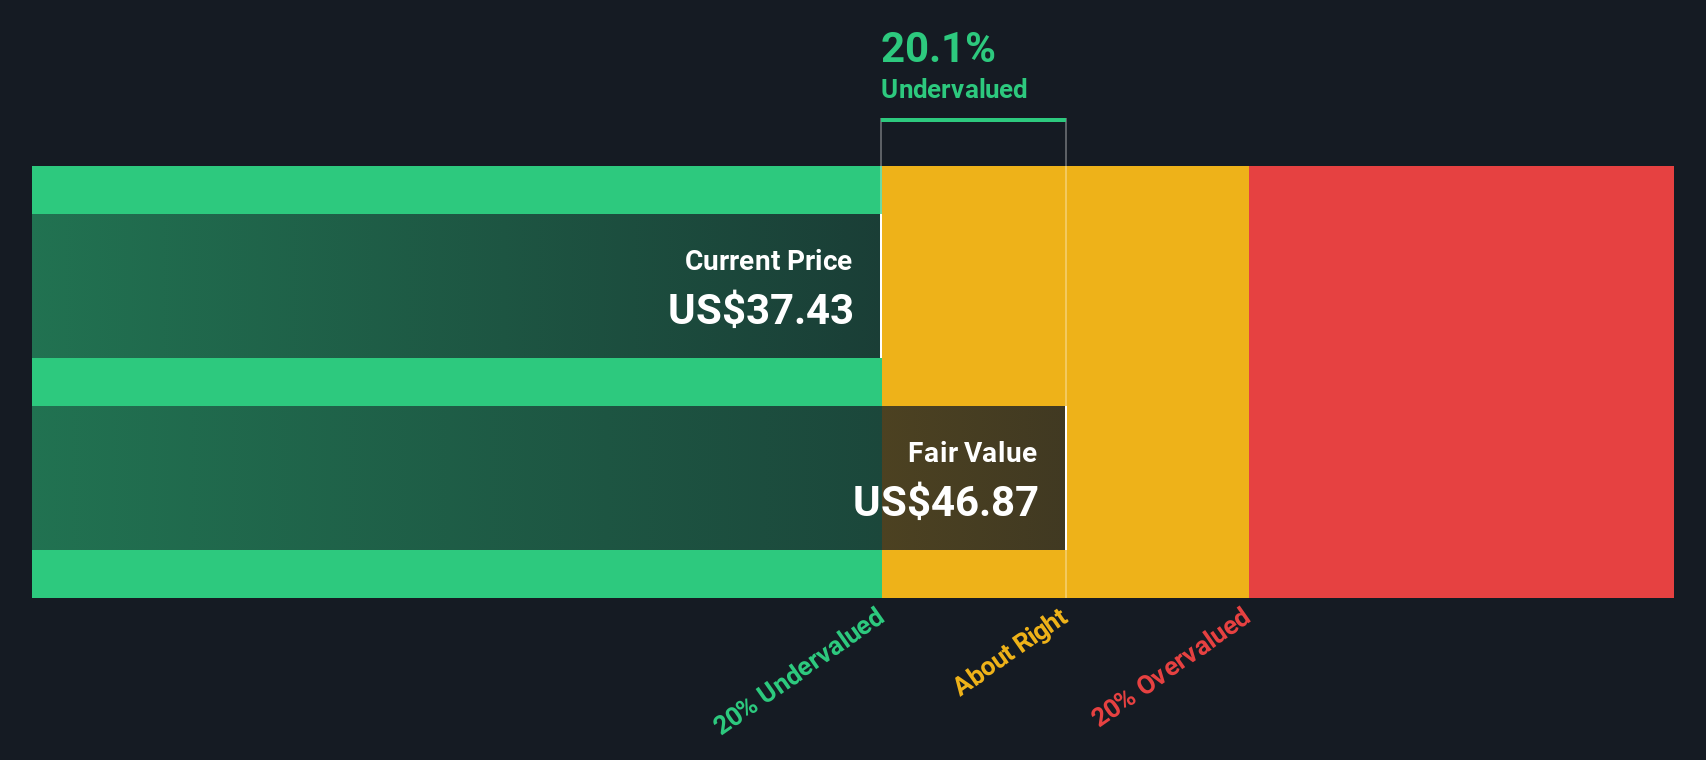
Fair value: $37.27 per share
Implied undervaluation vs last close: approximately 1.2%
Revenue growth assumption: 5.56%
- Sees Intel’s restructuring, portfolio refocus and manufacturing optimization improving agility, margins and long term cash flow.
- Expects AI workloads and foundry services to become meaningful growth drivers as customer trust and capacity utilization build.
- Views current pricing as roughly in line with intrinsic value, with upside tied to consistent execution and narrowing the technology gap.
Fair value: $28.47 per share
Implied overvaluation vs last close: approximately 29.3%
Revenue growth assumption: 5.9%
- Highlights Intel’s history of manufacturing delays and questions its ability to deliver multiple advanced nodes on schedule.
- Argues that AMD and Nvidia now hold stronger competitive positions in CPUs and AI accelerators, pressuring Intel’s share and pricing power.
- Sees the current share price as embedding an optimistic turnaround, leaving limited margin for error if execution or AI adoption disappoints.
Do you think there's more to the story for Intel? Head over to our Community to see what others are saying!
This article by Simply Wall St is general in nature. We provide commentary based on historical data and analyst forecasts only using an unbiased methodology and our articles are not intended to be financial advice. It does not constitute a recommendation to buy or sell any stock, and does not take account of your objectives, or your financial situation. We aim to bring you long-term focused analysis driven by fundamental data. Note that our analysis may not factor in the latest price-sensitive company announcements or qualitative material. Simply Wall St has no position in any stocks mentioned.
Have feedback on this article? Concerned about the content? Get in touch with us directly. Alternatively, email editorial-team@simplywallst.com