
 Nasdaq
 华尔街日报
华尔街日报Is ITT’s 2025 Rally Still Justified After Strong Infrastructure Gains?
- Wondering if ITT is still a smart buy after its big run, or if most of the upside is already priced in? Let us unpack what the current share price is really implying about future performance.
- The stock has climbed 24.5% year to date and 23.9% over the last year, with a 127.4% gain over 3 years and 143.5% over 5 years, even though it has dipped 3.4% over the past month and nudged up 1.5% in the last week.
- Investors have been reacting to a stream of positive developments around infrastructure spending, growing orders from industrial customers, and ITT's push into higher margin engineered solutions. These factors support a more confident growth story. At the same time, macro worries around interest rates and industrial demand cycles have injected some volatility into how the market is pricing that story.
- Despite that backdrop, ITT only scores 1 out of 6 on our fundamental undervaluation checks, which suggests the market may already be baking in a lot of good news, but not necessarily in the same way across every valuation lens. Next we will walk through different valuation approaches to see what they say about ITT, then finish with a more intuitive way to think about value that goes beyond the numbers alone.
ITT scores just 1/6 on our valuation checks. See what other red flags we found in the full valuation breakdown.
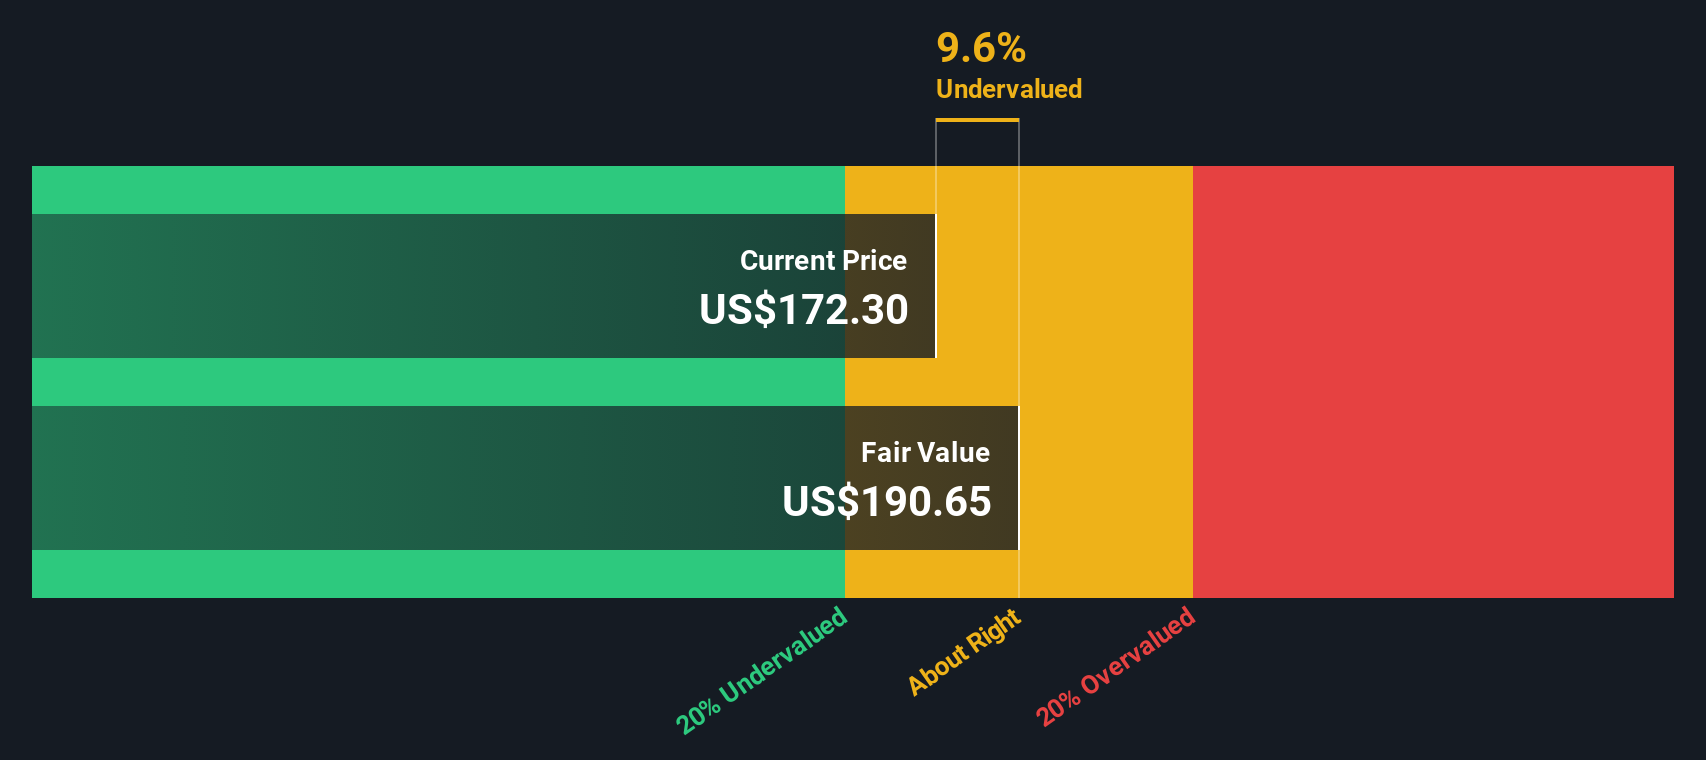
Approach 1: ITT Discounted Cash Flow (DCF) Analysis
A Discounted Cash Flow, or DCF, model estimates what a company is worth by projecting its future cash flows and then discounting them back to today using a required rate of return. For ITT, the model starts with last twelve month Free Cash Flow of about $540 million and uses analyst forecasts for the next few years, then extrapolates further growth beyond that. On this basis, Simply Wall St expects Free Cash Flow to rise to around $897 million by 2035, implying steady expansion as ITT benefits from higher margin engineered solutions and infrastructure exposure.
Adding up all those projected cash flows and discounting them back to today gives an estimated intrinsic value of about $149.58 per share. Compared with the current share price, the DCF implies ITT is roughly 18.0% overvalued. This suggests that a lot of future growth is already reflected in the market price and may leave a smaller margin of safety for new buyers.
Result: OVERVALUED
Our Discounted Cash Flow (DCF) analysis suggests ITT may be overvalued by 18.0%. Discover 914 undervalued stocks or create your own screener to find better value opportunities.
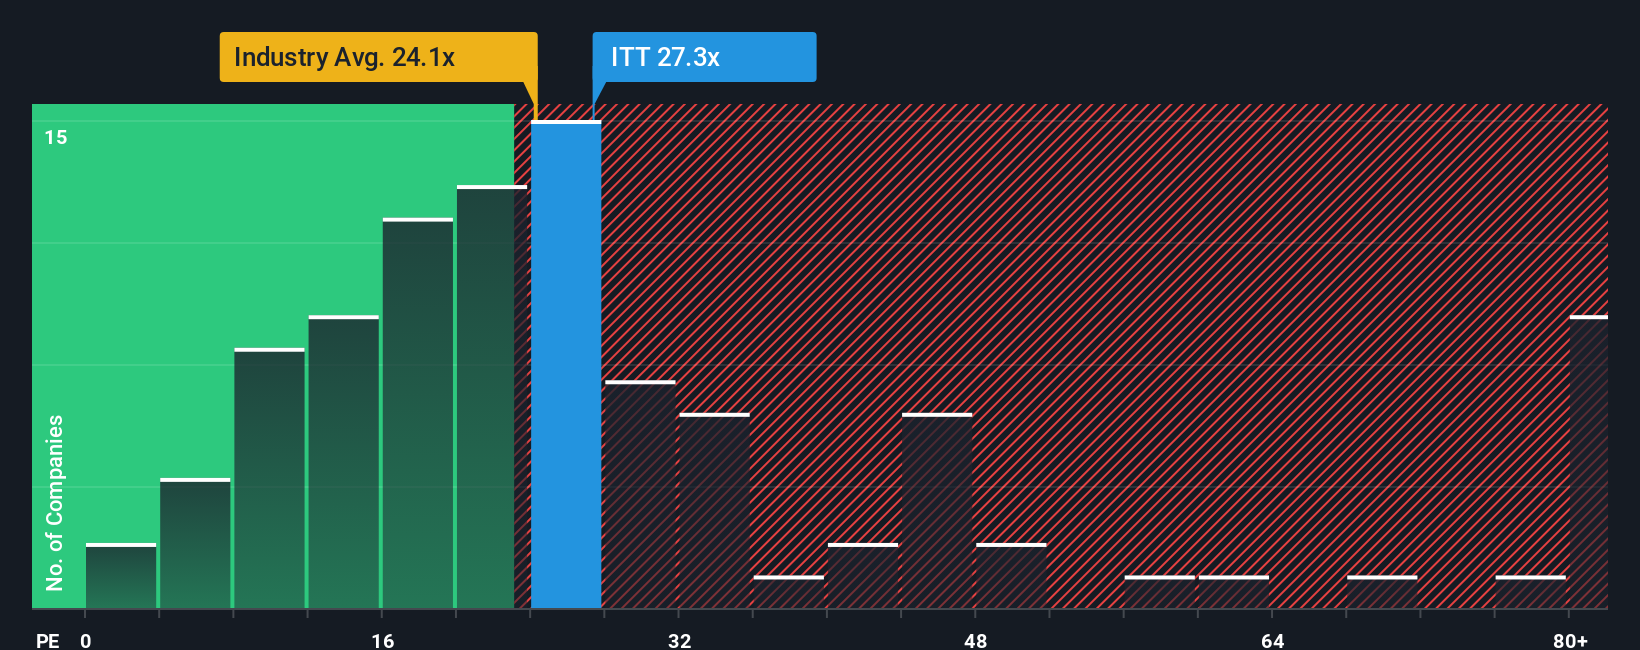
Approach 2: ITT Price vs Earnings
For a profitable business like ITT, the price to earnings, or PE, ratio is a useful way to gauge how much investors are willing to pay for each dollar of current earnings. In general, faster growing and lower risk companies tend to have a higher PE, while slower growth or more cyclical, risky names tend to trade on lower multiples.
ITT currently trades on a PE of about 31.5x, which is a premium to both the broader Machinery industry average of roughly 25.3x and the peer group average of about 34.0x. To refine that comparison, Simply Wall St calculates a Fair Ratio, its proprietary estimate of what ITT’s PE “should” be once factors such as earnings growth outlook, profitability, industry, market cap and key risks are taken into account. On this basis, ITT’s Fair Ratio comes out at around 26.2x, which is lower than today’s market multiple.
Because the current PE of 31.5x sits meaningfully above the 26.2x Fair Ratio, the multiple-based view aligns with the DCF work and points to ITT trading on a relatively rich valuation.
Result: OVERVALUED
PE ratios tell one story, but what if the real opportunity lies elsewhere? Discover 1465 companies where insiders are betting big on explosive growth.
Upgrade Your Decision Making: Choose your ITT Narrative
Earlier we mentioned that there is an even better way to understand valuation. Let us introduce you to Narratives, an easy tool on Simply Wall St’s Community page that lets you attach your own story about ITT’s future to specific revenue, earnings and margin forecasts. You can then link those numbers to a Fair Value and compare that Fair Value with today’s share price to decide whether to buy, hold or sell. The Narrative itself automatically updates as new news or earnings arrive. For example, one investor might build a bullish ITT Narrative that assumes high single digit revenue growth, mid teens margins and a Fair Value near the upper end of current targets around $208 because they believe record backlog and M&A execution will drive sustained margin expansion. A more cautious investor could set a lower growth and margin path that leads to a Fair Value closer to the low target of about $141, reflecting concerns over project risk, competition and macro headwinds.
Do you think there's more to the story for ITT? Head over to our Community to see what others are saying!

This article by Simply Wall St is general in nature. We provide commentary based on historical data and analyst forecasts only using an unbiased methodology and our articles are not intended to be financial advice. It does not constitute a recommendation to buy or sell any stock, and does not take account of your objectives, or your financial situation. We aim to bring you long-term focused analysis driven by fundamental data. Note that our analysis may not factor in the latest price-sensitive company announcements or qualitative material. Simply Wall St has no position in any stocks mentioned.
Have feedback on this article? Concerned about the content? Get in touch with us directly. Alternatively, email editorial-team@simplywallst.com