
 Nasdaq
 华尔街日报
华尔街日报Is Atmos Energy Still Attractive After Its Strong Multi Year Share Price Surge in 2025?
- If you are wondering whether Atmos Energy is still a smart buy after its long run up, or if you would be overpaying at today’s price, this article will walk through what the numbers are really saying about its valuation.
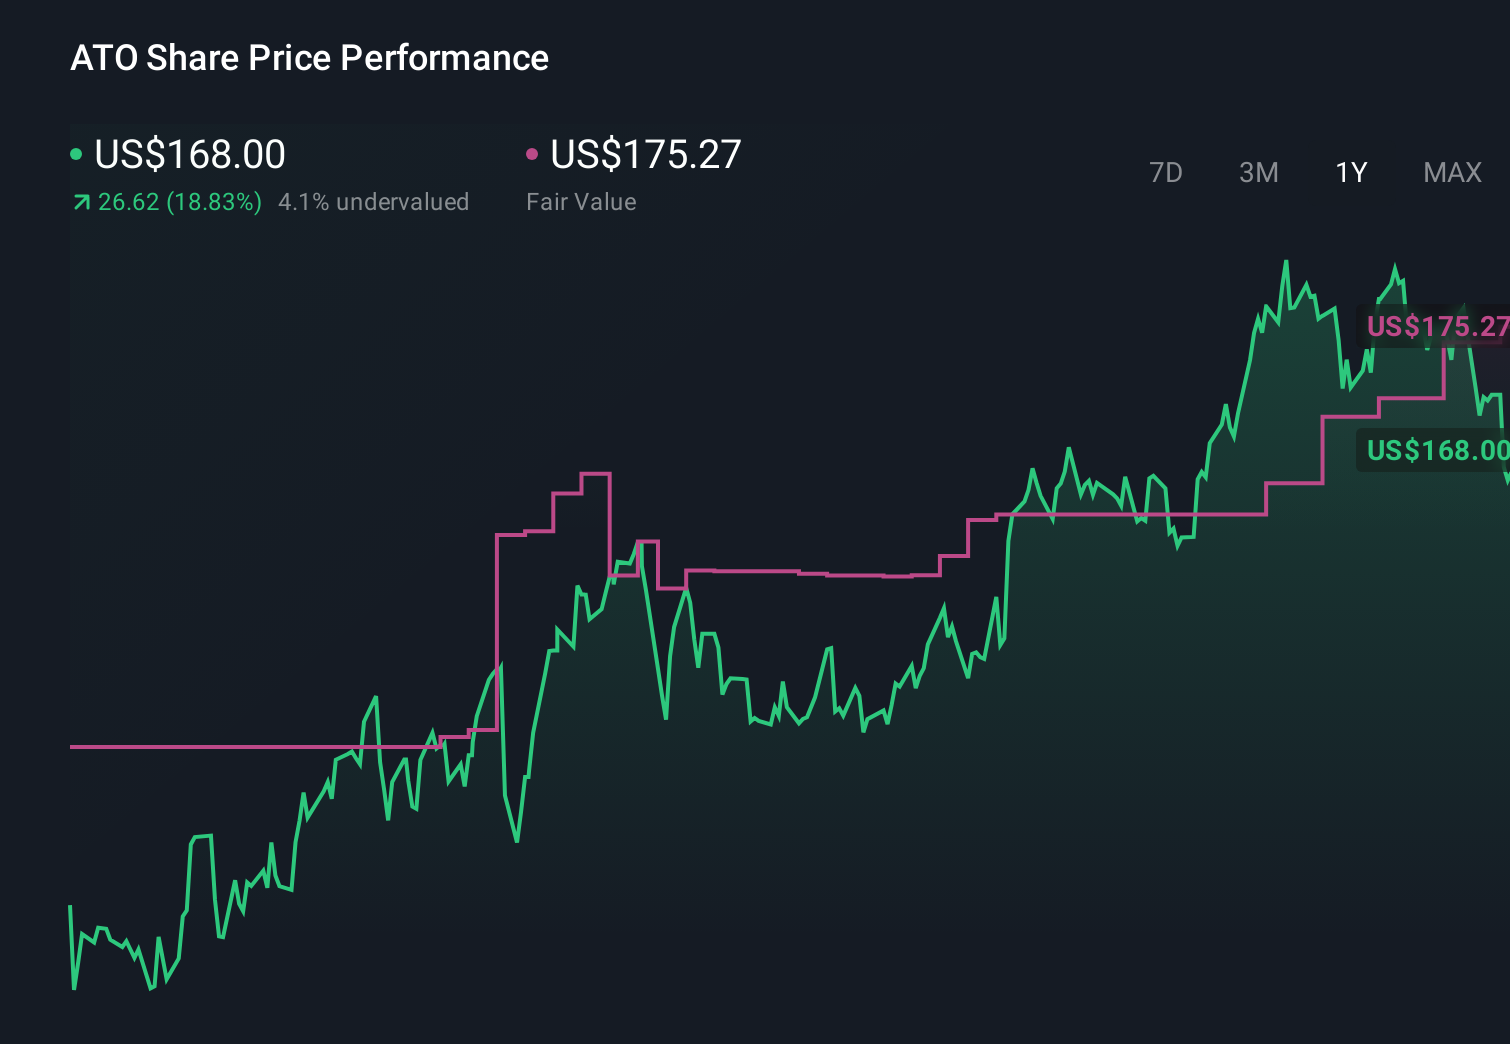
- Even after a small pullback of about 1.0% over the last week and 4.2% over the last month, the stock is still up roughly 20.5% year to date and 22.0% over the past year, building on strong multi year gains of 56.1% over three years and 103.8% over five.
- Recent price moves have been driven less by flashy headlines and more by a steady drumbeat of updates around US natural gas infrastructure, regulated rate frameworks, and ongoing investments in pipeline modernization. For a steady utility like Atmos, these slow burning developments can quietly reshape long term cash flow expectations, and the market has been adjusting its view accordingly.
- On our valuation checklist, Atmos Energy scores just 1 out of 6 for being undervalued. This suggests the headline numbers might not scream bargain, but they also do not tell the full story. Next, we will unpack the standard valuation methods investors rely on, before finishing with a more nuanced way to judge whether the current price truly makes sense.
Atmos Energy scores just 1/6 on our valuation checks. See what other red flags we found in the full valuation breakdown.
Approach 1: Atmos Energy Dividend Discount Model (DDM) Analysis
The Dividend Discount Model estimates what a stock is worth by projecting all future dividends a company is expected to pay and discounting them back to today, based on the risk investors are taking. It is particularly useful for stable, dividend paying utilities like Atmos Energy.
Atmos currently pays an annual dividend per share of about $4.51, with a payout ratio near 47%, meaning less than half of earnings are returned to shareholders while the rest is reinvested. The company’s return on equity is around 9.0%. Simply Wall St caps its long term dividend growth rate at 3.26%, slightly below the model’s raw growth estimate of roughly 4.75%, to stay conservative for a regulated utility.
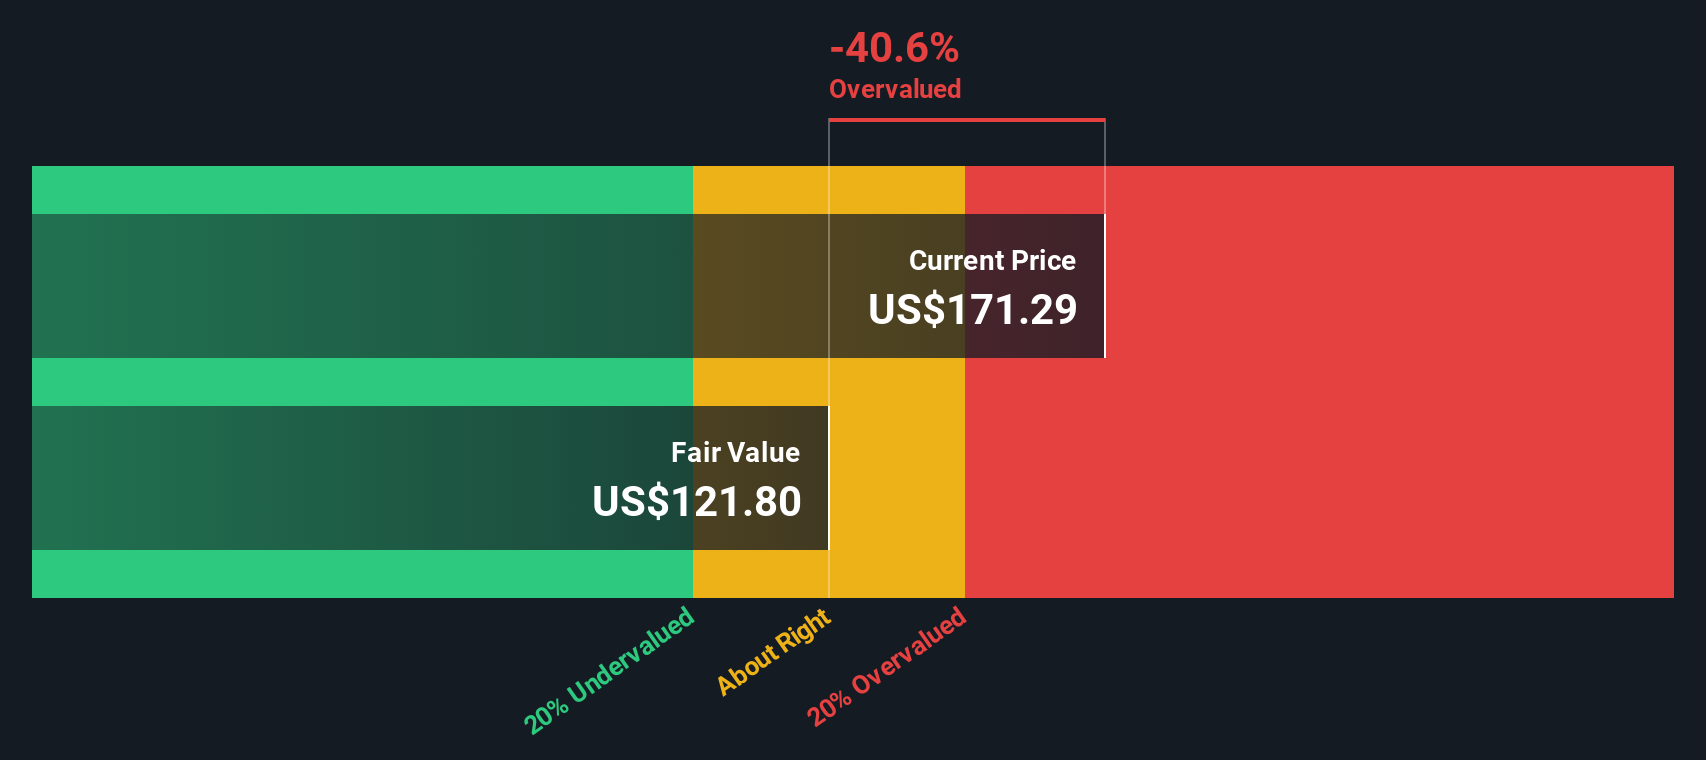
Under these assumptions, the DDM points to an intrinsic value of roughly $122 per share. With the model indicating the stock is about 36.7% above this estimate, Atmos screens as clearly overvalued on a dividend basis at current levels.
Result: OVERVALUED
Our Dividend Discount Model (DDM) analysis suggests Atmos Energy may be overvalued by 36.7%. Discover 914 undervalued stocks or create your own screener to find better value opportunities.
Approach 2: Atmos Energy Price vs Earnings
For profitable, established companies like Atmos Energy, the price to earnings (PE) ratio is a straightforward way to gauge how much investors are willing to pay today for each dollar of current earnings. In general, the higher the expected growth and the lower the perceived risk, the higher a stock’s “normal” or “fair” PE multiple tends to be.
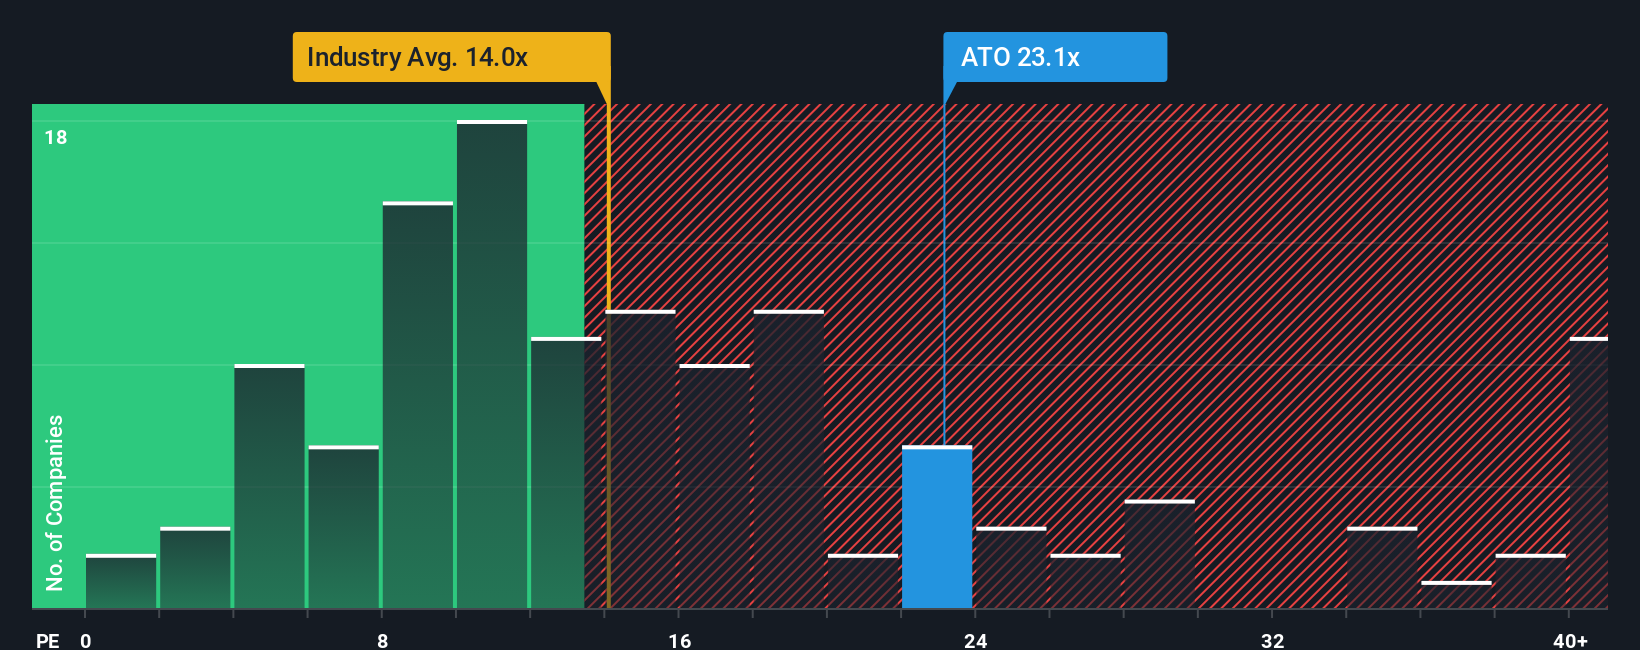
Atmos currently trades on a PE of about 22.5x. That is a premium to both the Gas Utilities industry average of roughly 13.9x and the broader peer group, which sits closer to 17.4x. On the surface, that makes Atmos look relatively expensive compared to similar companies.
Simply Wall St’s Fair Ratio provides a more tailored benchmark by estimating the PE multiple a stock deserves based on its own earnings growth outlook, profitability, risk profile, industry, and market cap. For Atmos, this Fair Ratio is around 23.4x, slightly above where the stock trades today. Because the actual PE is modestly below this custom fair value marker, Atmos appears marginally undervalued on a PE basis, despite its premium to the sector.
Result: UNDERVALUED
PE ratios tell one story, but what if the real opportunity lies elsewhere? Discover 1465 companies where insiders are betting big on explosive growth.
Upgrade Your Decision Making: Choose your Atmos Energy Narrative
Earlier we mentioned that there is an even better way to understand valuation. Let us introduce you to Narratives, a simple framework on Simply Wall St’s Community page that lets you turn your view of Atmos Energy into a short story that links its business drivers to a financial forecast and, ultimately, to a fair value estimate you can compare against today’s share price to decide whether to buy, hold, or sell. The platform then automatically updates your Narrative when new news or earnings arrive so your assumptions, projected revenues, margins, and earnings, and resulting fair value always reflect the latest information. Different investors can look at the same facts and reach very different but clearly structured conclusions. For example, one Atmos Narrative might assume strong long term growth in customers, margins, and regulated returns and arrive at a fair value close to the higher end of recent targets around $182 per share. A more cautious Narrative that leans into regulatory and cost risks could land nearer the lower end, closer to $141. This highlights that the power of Narratives lies in making your reasoning visible, comparable, and easy to reassess over time.
Do you think there's more to the story for Atmos Energy? Head over to our Community to see what others are saying!
This article by Simply Wall St is general in nature. We provide commentary based on historical data and analyst forecasts only using an unbiased methodology and our articles are not intended to be financial advice. It does not constitute a recommendation to buy or sell any stock, and does not take account of your objectives, or your financial situation. We aim to bring you long-term focused analysis driven by fundamental data. Note that our analysis may not factor in the latest price-sensitive company announcements or qualitative material. Simply Wall St has no position in any stocks mentioned.
Have feedback on this article? Concerned about the content? Get in touch with us directly. Alternatively, email editorial-team@simplywallst.com