
 Nasdaq
 华尔街日报
华尔街日报Is Astellas Pharma Still Attractive After a 43% Surge and DCF Upside Signals?
- Wondering if Astellas Pharma’s strong run still offers value, or if you might be late to the party? This breakdown will help you decide whether the current price still makes sense.
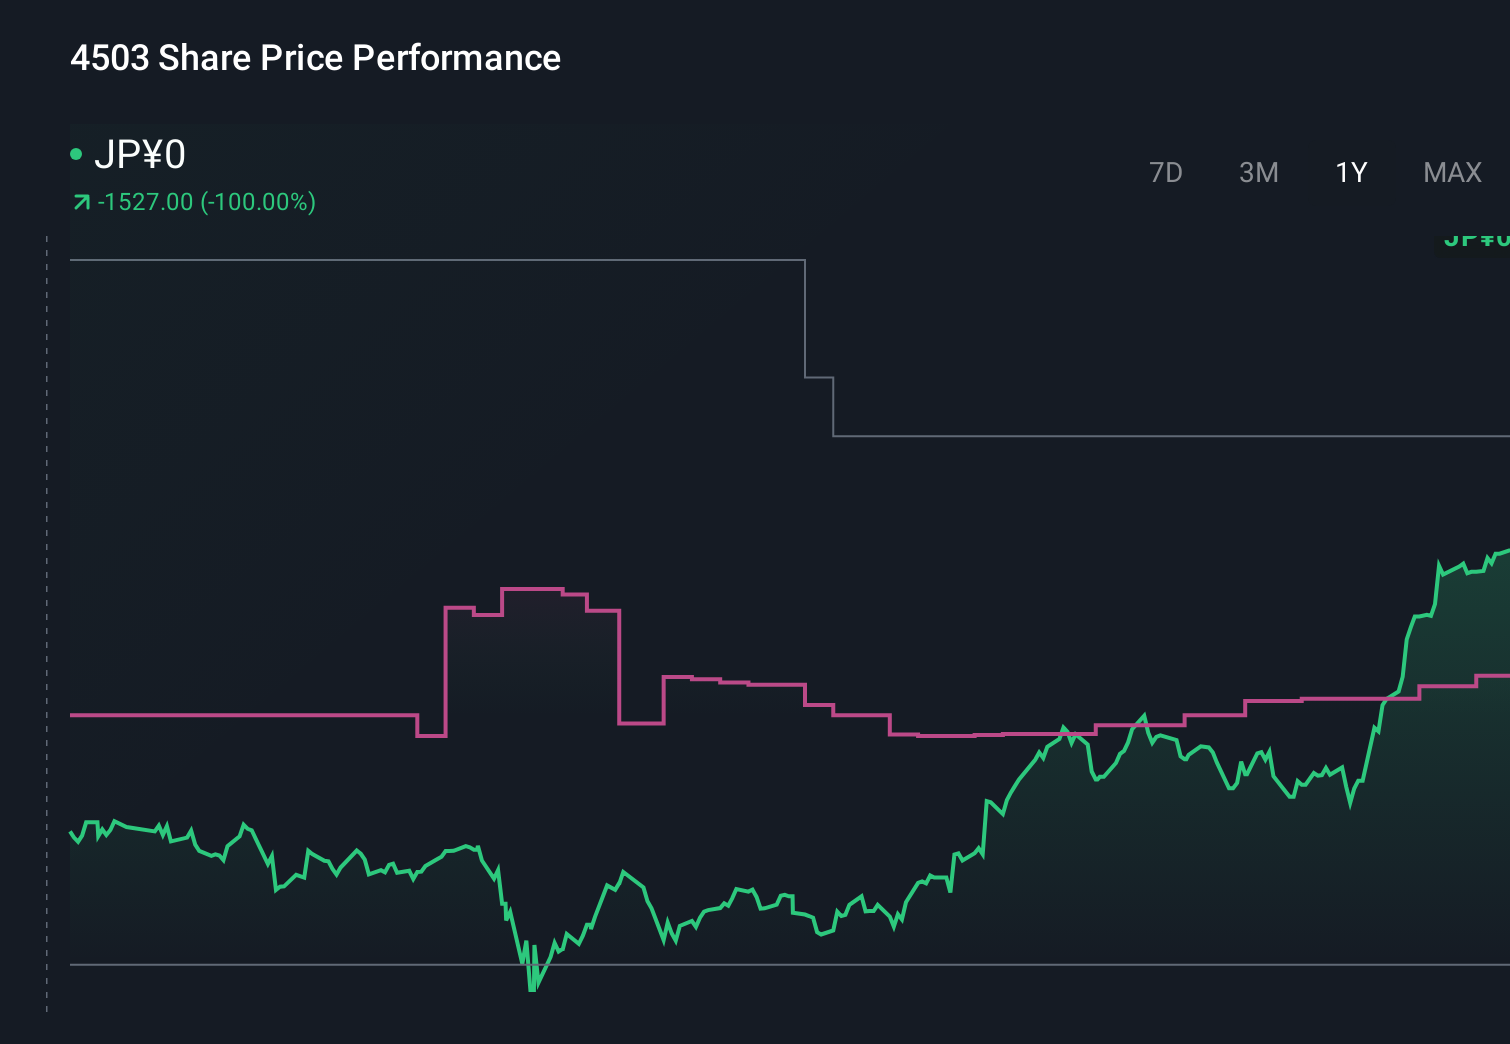
- The stock has climbed 2.2% over the last week, 9.7% in the past month, and is up 37.5% year to date and 43.0% over the last year, so it is firmly on many investors’ radar.
- Recent headlines have focused on Astellas expanding its pipeline through strategic partnerships and regulatory milestones for key therapies, which has helped fuel optimism around its future cash flows. At the same time, discussion around Japan’s changing healthcare landscape and drug pricing reforms has added a layer of both opportunity and risk to the story.
- Right now Astellas scores 2 out of 6 on our undervaluation checks. In the next sections we will unpack what that means across different valuation methods, while hinting at a more powerful way to think about value that we will come back to at the end.
Astellas Pharma scores just 2/6 on our valuation checks. See what other red flags we found in the full valuation breakdown.
Approach 1: Astellas Pharma Discounted Cash Flow (DCF) Analysis
A Discounted Cash Flow model estimates what a company is worth today by projecting the cash it can generate in the future and discounting those cash flows back to the present.
For Astellas Pharma, the latest twelve month Free Cash Flow is about ¥314.4 billion, and analysts expect this to grow, with projections such as ¥293.8 billion in 2026 rising to around ¥372.8 billion in 2027. By 2030, projected Free Cash Flow is approximately ¥336.5 billion, with years beyond the analyst horizon extrapolated by Simply Wall St based on recent trends, rather than direct analyst estimates.
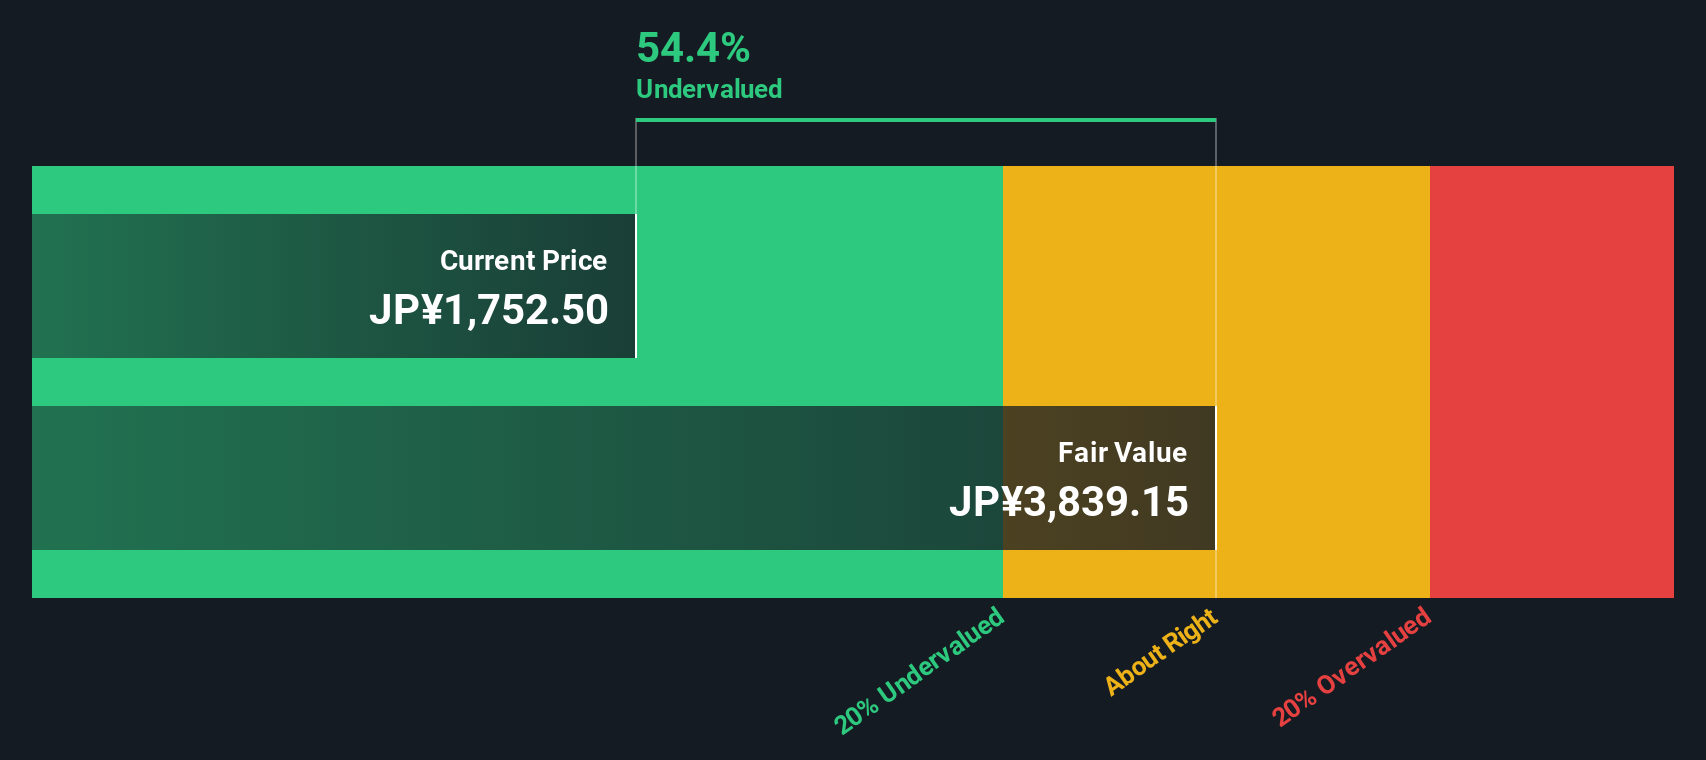
Feeding these cash flow projections into a 2 Stage Free Cash Flow to Equity model produces an estimated intrinsic value of roughly ¥4,142 per share. Compared with the current market price, this implies the stock is trading at about a 49.3% discount, suggesting investors are paying considerably less than the modelled value of future cash flows.
This DCF view indicates potential upside if Astellas meets or exceeds these cash flow expectations.
Result: UNDERVALUED
Our Discounted Cash Flow (DCF) analysis suggests Astellas Pharma is undervalued by 49.3%. Track this in your watchlist or portfolio, or discover 914 more undervalued stocks based on cash flows.
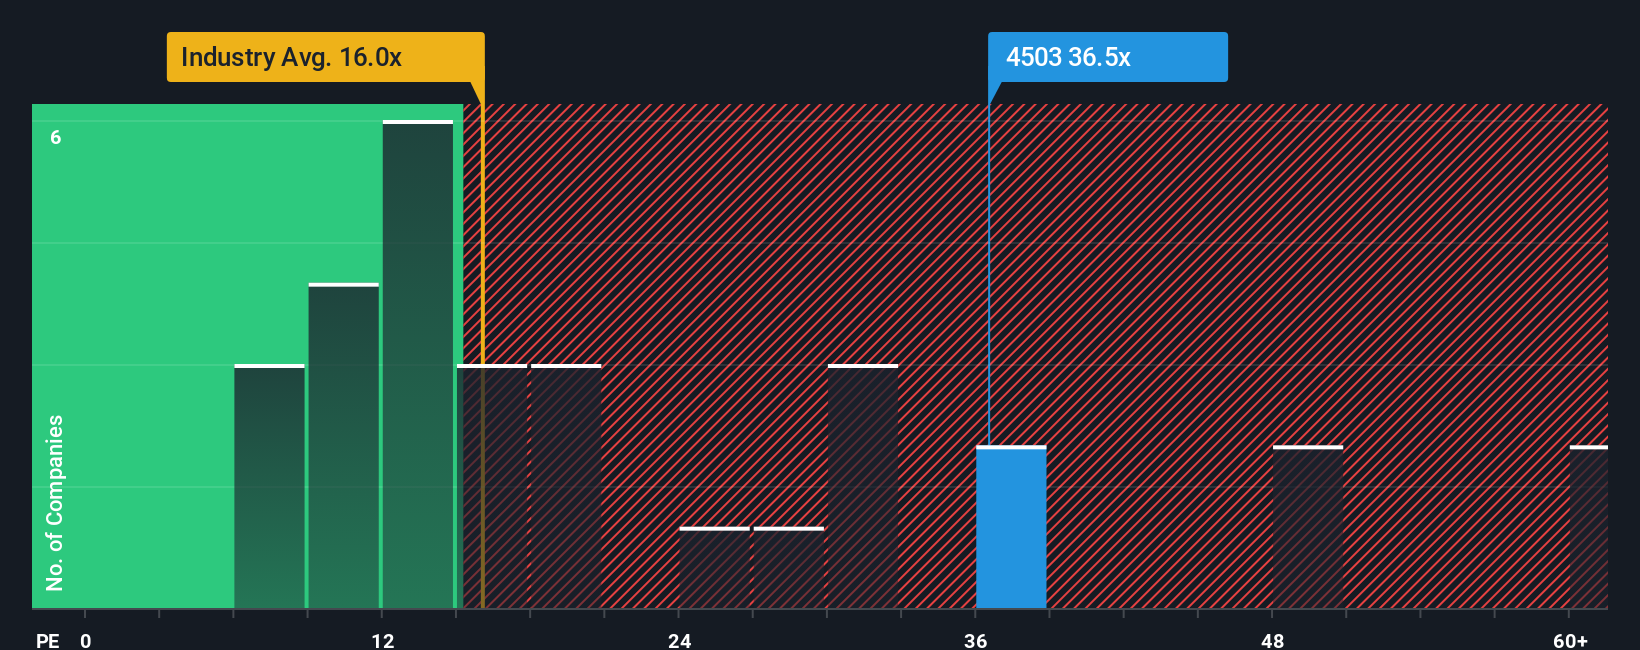
Approach 2: Astellas Pharma Price vs Earnings
For profitable companies like Astellas Pharma, the Price to Earnings (PE) ratio is a useful way to gauge value because it links what investors pay directly to the earnings the business generates today. In general, faster growth and lower risk justify a higher PE, while slower or less certain growth tends to pull a “normal” or “fair” PE down.
Astellas currently trades on a PE of about 30.1x. That is meaningfully higher than both the Pharmaceuticals industry average of roughly 16.4x and the peer group average of around 20.6x. This suggests the market is already assigning a premium for its prospects. However, Simply Wall St’s proprietary Fair Ratio for Astellas is about 22.8x, which reflects what investors might reasonably pay given its earnings growth outlook, margins, size, industry characteristics and risk profile.
This Fair Ratio approach is more tailored than a simple peer or industry comparison because it adjusts for company specific strengths and weaknesses rather than assuming all drug makers deserve the same multiple. Comparing 30.1x to the 22.8x Fair Ratio indicates the shares are pricing in more optimism than our fundamentals based model supports.
Result: OVERVALUED
PE ratios tell one story, but what if the real opportunity lies elsewhere? Discover 1466 companies where insiders are betting big on explosive growth.
Upgrade Your Decision Making: Choose your Astellas Pharma Narrative
Earlier we mentioned that there is an even better way to understand valuation, so let us introduce you to Narratives. These are simply your story about a company translated into numbers, where you spell out your view on Astellas Pharma’s future revenue, earnings and margins, connect that story to a financial forecast and a fair value, and then compare that fair value with today’s price to decide whether you would buy, hold or sell.
On Simply Wall St’s Community page, millions of investors use Narratives as an easy, accessible tool that stays up to date as new information such as earnings, guidance or drug news arrives. This means your story and fair value view evolve with the business rather than staying frozen at one point in time.
For example, one Astellas Narrative might lean bullish, expecting earnings closer to the high end of around ¥322.2 billion and a fair value near ¥2,200 per share. A more cautious Narrative could anchor on earnings nearer ¥114.4 billion and a fair value closer to ¥1,300. Seeing those different stories side by side helps you decide which assumptions you believe and what that means for your next move.
Do you think there's more to the story for Astellas Pharma? Head over to our Community to see what others are saying!
This article by Simply Wall St is general in nature. We provide commentary based on historical data and analyst forecasts only using an unbiased methodology and our articles are not intended to be financial advice. It does not constitute a recommendation to buy or sell any stock, and does not take account of your objectives, or your financial situation. We aim to bring you long-term focused analysis driven by fundamental data. Note that our analysis may not factor in the latest price-sensitive company announcements or qualitative material. Simply Wall St has no position in any stocks mentioned.
Have feedback on this article? Concerned about the content? Get in touch with us directly. Alternatively, email editorial-team@simplywallst.com