
 Nasdaq
 华尔街日报
华尔街日报Xometry (XMTR): Reassessing Valuation After Strong Q3, Raised 2025 Guidance and Growing AI Marketplace Optimism
Xometry (XMTR) grabbed investors attention after its latest Q3 report, with strong revenue growth, better adjusted profitability, and higher guidance for Q4 and full year 2025 reshaping expectations.
See our latest analysis for Xometry.
The Q3 beat and upgraded outlook seem to be feeding into a clear uptrend, with a roughly 48% year to date share price return and a near doubling three year total shareholder return. This hints that investors see building momentum and improving risk reward.
If Xometry's move has you rethinking where growth could come from next, this might be a good moment to explore fast growing stocks with high insider ownership as a fresh source of ideas.
Yet with the shares now up sharply and trading only slightly below analyst targets, investors face a key question: Is Xometry still undervalued on its long term AI marketplace potential, or is the market already pricing in that growth?
Most Popular Narrative: 6% Undervalued
With Xometry shares last closing at $61.51 against a narrative fair value of about $65.44, the story hinges on ambitious growth and margin lift.
The rapid deployment of AI and machine learning across pricing, supplier selection, and workflow automation is substantially improving efficiency, optimizing gross margin, and providing significant operating leverage, positioning the company for margin expansion and improving EBITDA.
Curious how far this operating leverage can really stretch? The narrative quietly bakes in powerful revenue compounding and a profit mix more typical of mature platforms. Want to see the exact assumptions behind that premium earnings multiple and what they imply for future cash flows?
Result: Fair Value of $65.44 (UNDERVALUED)
Have a read of the narrative in full and understand what's behind the forecasts.
However, sustained losses, heavy AI investment, and intensifying competition could quickly challenge the margin expansion and premium multiple that this narrative relies on.
Find out about the key risks to this Xometry narrative.
Another Lens on Valuation
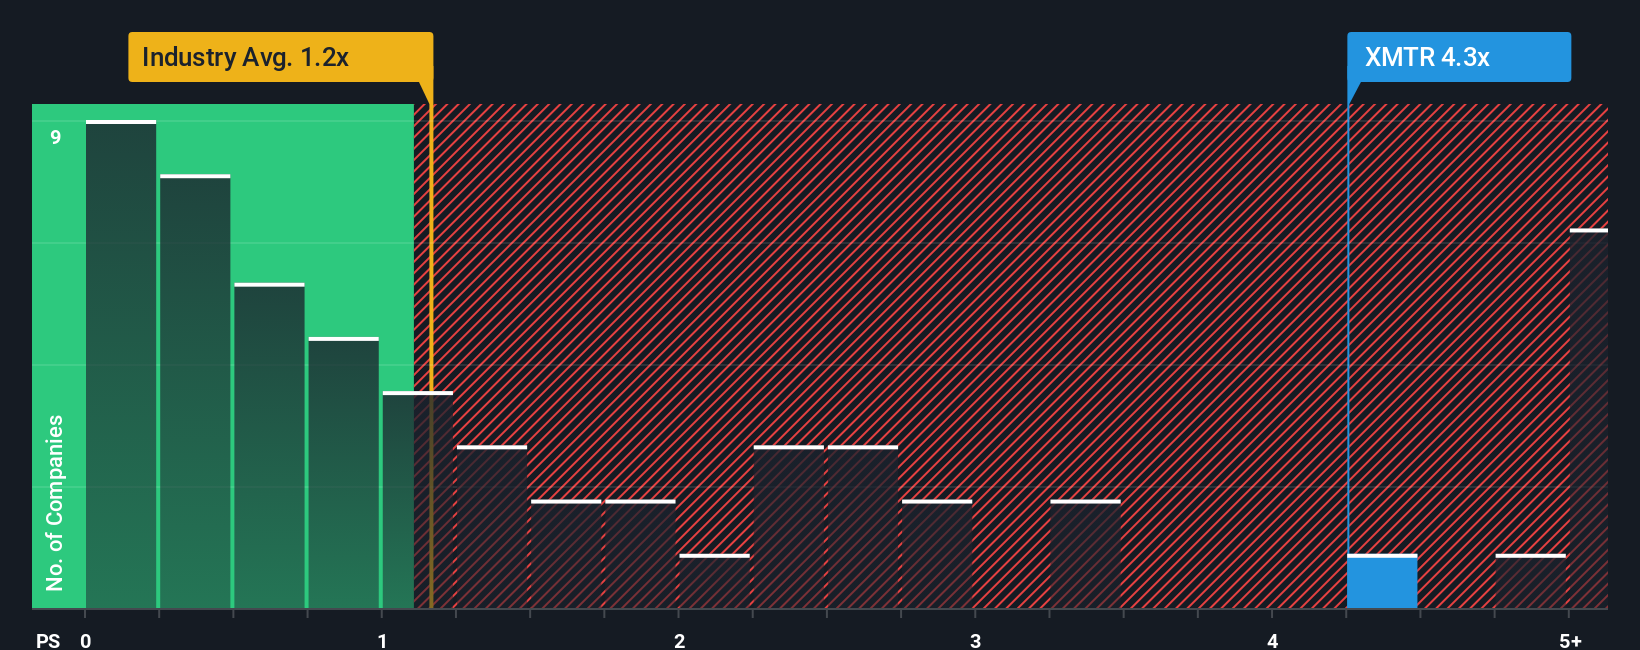
Step back from the growth story and the numbers look stretched. Xometry trades on a price to sales ratio of 4.9 times, far above the US Trade Distributors industry at 1.2 times, peers at 1.3 times, and even its own fair ratio estimate of 3.3 times. That premium suggests the market is already baking in a lot of success, so it is worth asking how much upside is really left if execution wobbles.
See what the numbers say about this price — find out in our valuation breakdown.
Build Your Own Xometry Narrative
If you see the story differently or want to stress test your own assumptions against the numbers, you can build a complete narrative in just a few minutes: Do it your way
A great starting point for your Xometry research is our analysis highlighting 1 key reward and 1 important warning sign that could impact your investment decision.
Ready for more high conviction ideas?
Before you move on, lock in your next potential winners with targeted ideas from the Simply Wall St Screener, instead of waiting for opportunities to pass by.
- Capture early growth stories at compelling prices by zeroing in on these 914 undervalued stocks based on cash flows that the market has not fully appreciated yet.
- Ride powerful structural trends by focusing on these 29 healthcare AI stocks using cutting edge algorithms to transform diagnostics, treatment, and operational efficiency.
- Position yourself for asymmetric upside by filtering for these 79 cryptocurrency and blockchain stocks linked to blockchain infrastructure, payment networks, and emerging digital asset platforms.
This article by Simply Wall St is general in nature. We provide commentary based on historical data and analyst forecasts only using an unbiased methodology and our articles are not intended to be financial advice. It does not constitute a recommendation to buy or sell any stock, and does not take account of your objectives, or your financial situation. We aim to bring you long-term focused analysis driven by fundamental data. Note that our analysis may not factor in the latest price-sensitive company announcements or qualitative material. Simply Wall St has no position in any stocks mentioned.
Have feedback on this article? Concerned about the content? Get in touch with us directly. Alternatively, email editorial-team@simplywallst.com