
 Nasdaq
 华尔街日报
华尔街日报Is RH’s Luxury Expansion Strategy Enough After a 57% Slide in 2025?
- Wondering if RH at around $170 a share is a beaten down bargain or a value trap in disguise? This breakdown will help you frame the opportunity and the risks with a cool head.
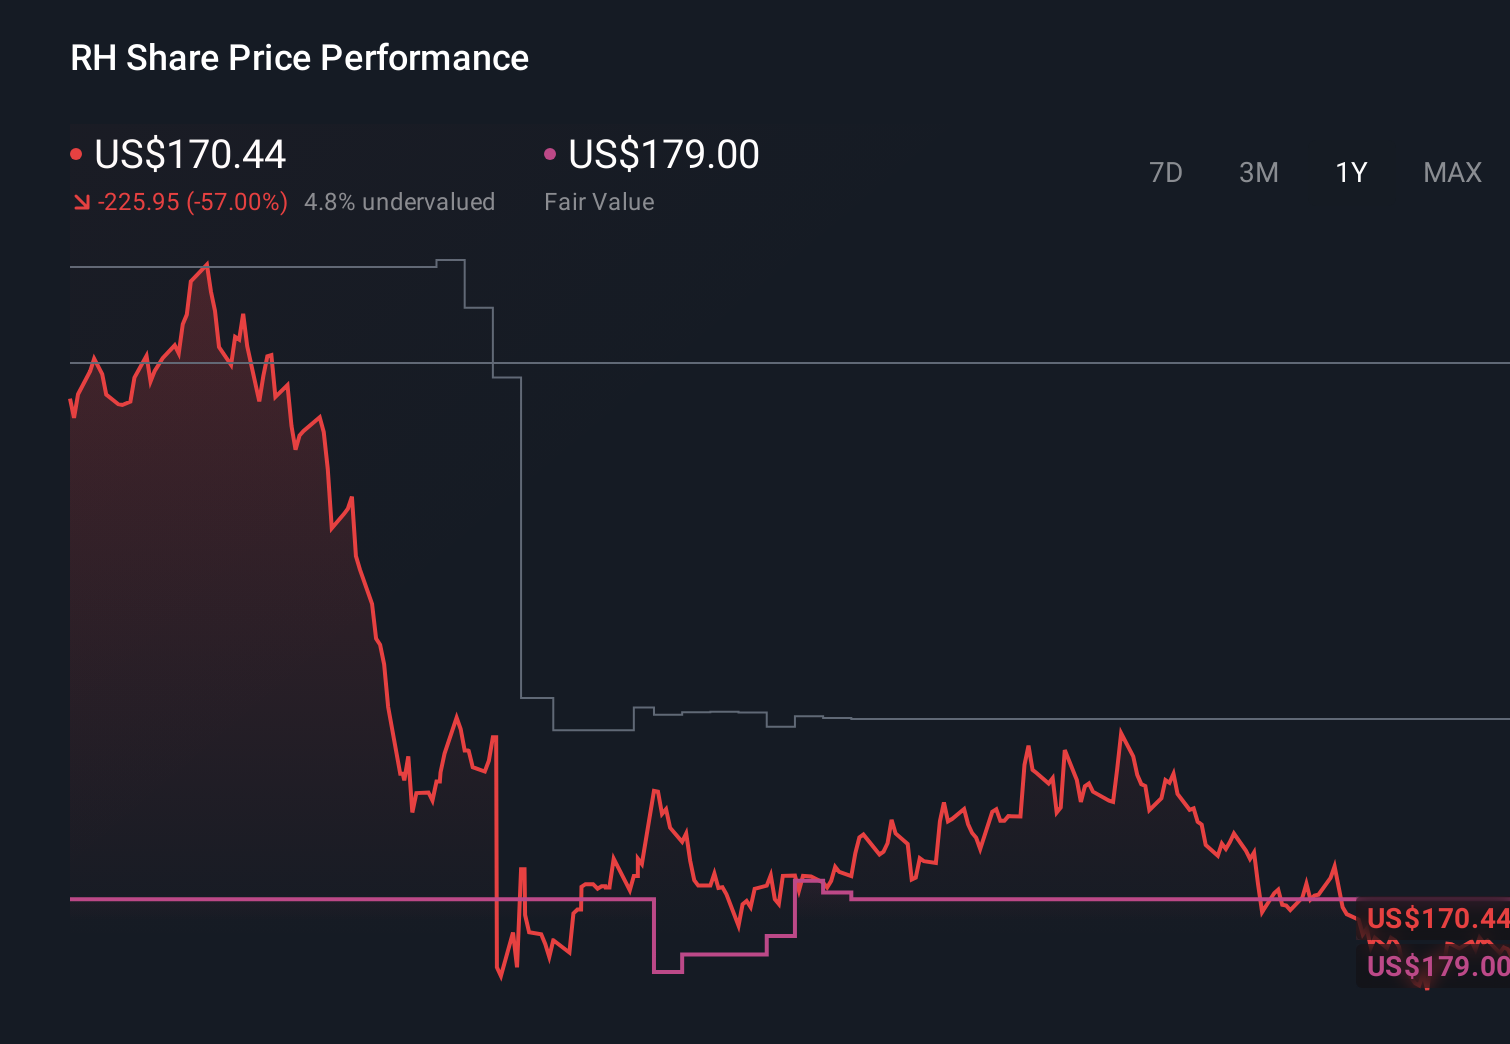
- The stock has bounced about 5.5% over the last week and 16.5% over the past month, even though it is still down roughly 56.7% year to date and 57.1% over the last year. This suggests sentiment might be trying to turn after a brutal slide.
- Recent headlines have focused on RH doubling down on its ultra high end brand strategy, from expanding its gallery footprint in key luxury markets to pushing deeper into high margin categories like bespoke interiors and lifestyle experiences. These moves are meant to support a long term premium positioning, which helps explain why some investors are starting to re examine the stock despite its rough performance.
- Right now RH scores a 3 out of 6 on our valuation checks, suggesting there are pockets of undervaluation but also areas where the price still looks demanding. In the sections ahead we will walk through those different valuation lenses before finishing with a more powerful way to think about what RH is really worth.
Find out why RH's -57.1% return over the last year is lagging behind its peers.
Approach 1: RH Discounted Cash Flow (DCF) Analysis
A Discounted Cash Flow model estimates what a business is worth by projecting the cash it can generate in the future and discounting those cash flows back to today in dollar terms. For RH, the model used is a 2 stage Free Cash Flow to Equity approach, which first relies on analyst forecasts and then extends those trends further out.
RH generated about $76.4 million in free cash flow over the last twelve months. Analyst and extrapolated projections see this rising significantly, with free cash flow expected to reach roughly $1.0 billion by 2035 as the business scales its high end strategy. Simply Wall St converts those yearly estimates into today’s dollars, then sums them to arrive at an intrinsic value per share.
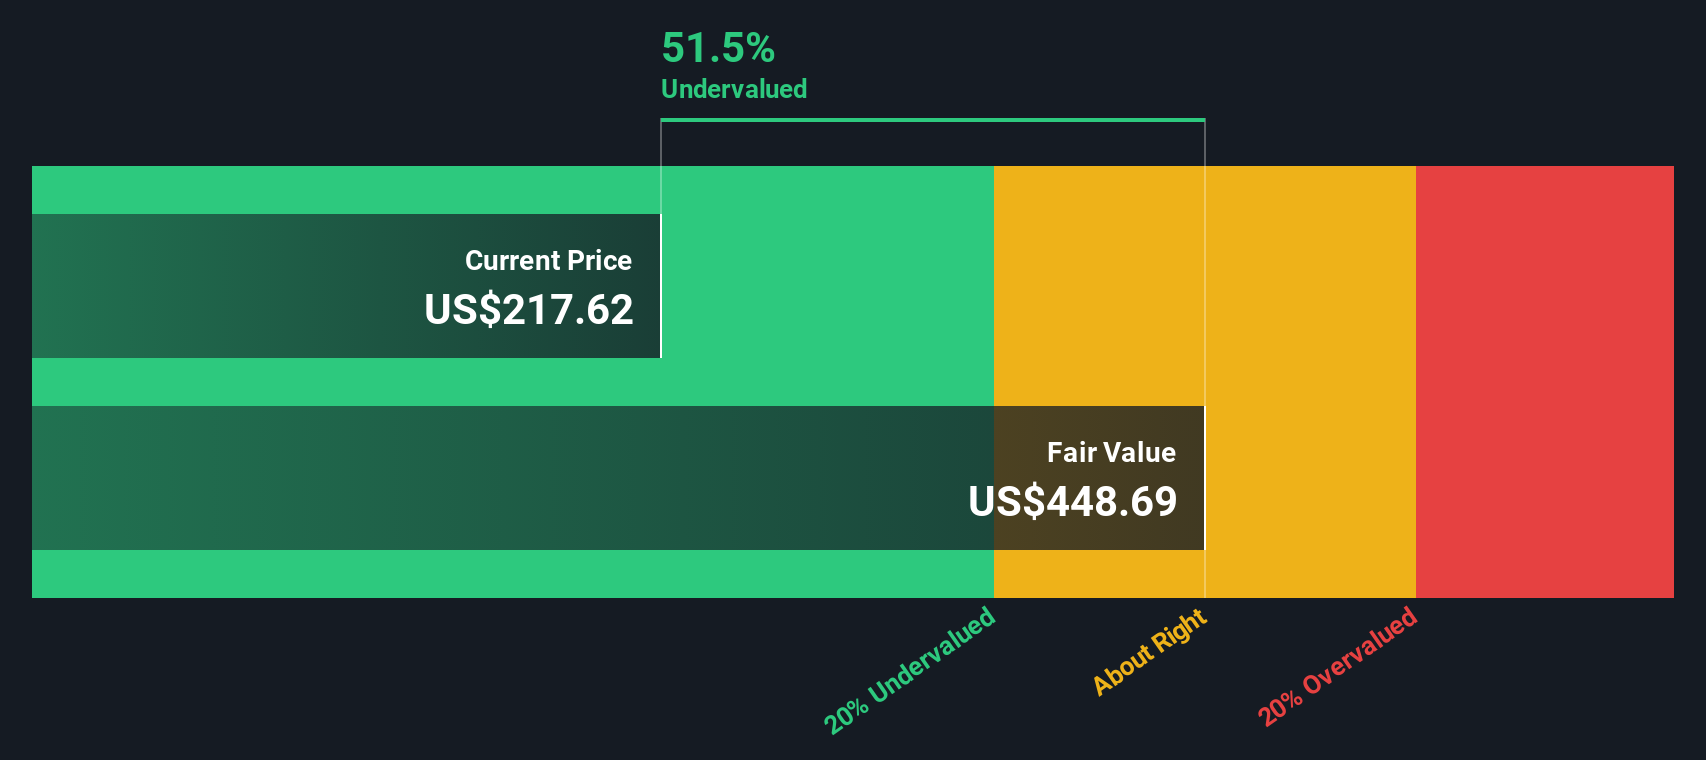
On this basis, RH’s DCF fair value is about $373.44 per share versus a current price near $170, implying the shares trade at roughly a 54.2% discount. That suggests the market is pricing in far weaker long term cash generation than this model assumes.
Result: UNDERVALUED
Our Discounted Cash Flow (DCF) analysis suggests RH is undervalued by 54.2%. Track this in your watchlist or portfolio, or discover 914 more undervalued stocks based on cash flows.
Approach 2: RH Price vs Earnings
For profitable companies like RH, the price to earnings ratio is a handy way to see how much investors are paying for each dollar of current profit. A higher PE can sometimes be associated with strong growth prospects and relatively low risk, while slower growth or higher uncertainty generally calls for a lower, more conservative multiple.
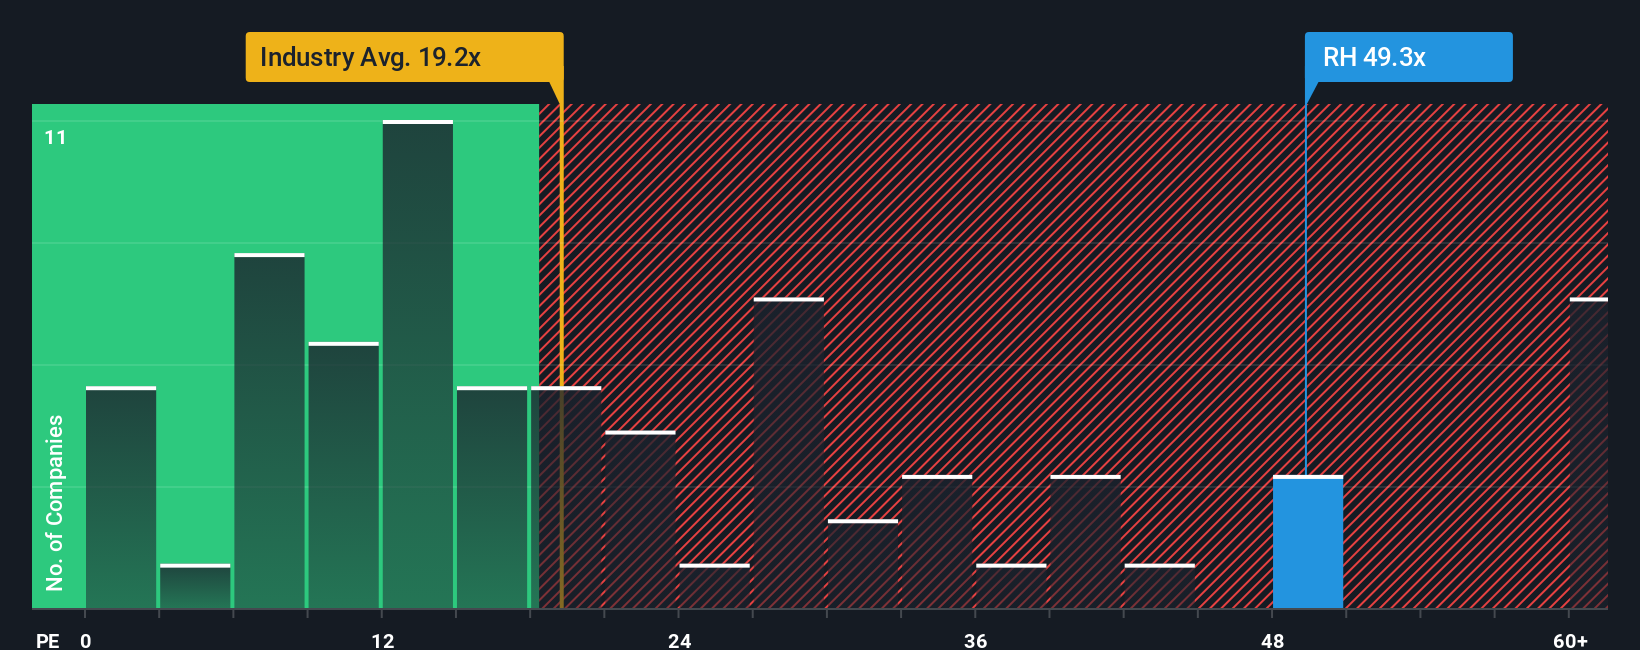
RH currently trades on a PE of about 29.2x, which is richer than both the Specialty Retail industry average of roughly 21.1x and the peer average near 19.1x. That premium suggests the market already prices in stronger growth or a higher quality business than many of its rivals.
Simply Wall St’s Fair Ratio framework goes a step further by estimating what PE RH could trade at, given its earnings growth profile, margins, industry, market value and risk factors. On this basis, RH’s Fair Ratio is around 30.3x, slightly above where the stock trades today. That indicates the current valuation is a bit below what its fundamentals might warrant, pointing to potential upside if the company delivers on expectations.
Result: UNDERVALUED
PE ratios tell one story, but what if the real opportunity lies elsewhere? Discover 1466 companies where insiders are betting big on explosive growth.
Upgrade Your Decision Making: Choose your RH Narrative
Earlier we mentioned that there is an even better way to understand valuation, so let us introduce you to Narratives, a simple framework that lets you attach a clear story to your assumptions about RH’s future revenue, earnings, margins and fair value. A Narrative is your personal view of how the business evolves over time, linked directly to a financial forecast and then to a fair value estimate, so you can see how your beliefs translate into numbers. On Simply Wall St’s Community page, used by millions of investors, Narratives are an easy, guided tool that help you compare your Fair Value to the current market Price. They also update dynamically as new news, guidance or earnings are released, so your view stays current without you rebuilding everything from scratch. For example, one RH Narrative might assume galleries and new sourcebooks drive growth and justify a fair value near $436. A more cautious Narrative might focus on housing risk and debt and land closer to $179. Where you sit between those views defines the story and valuation you choose to back with your capital.
Do you think there's more to the story for RH? Head over to our Community to see what others are saying!
This article by Simply Wall St is general in nature. We provide commentary based on historical data and analyst forecasts only using an unbiased methodology and our articles are not intended to be financial advice. It does not constitute a recommendation to buy or sell any stock, and does not take account of your objectives, or your financial situation. We aim to bring you long-term focused analysis driven by fundamental data. Note that our analysis may not factor in the latest price-sensitive company announcements or qualitative material. Simply Wall St has no position in any stocks mentioned.
Have feedback on this article? Concerned about the content? Get in touch with us directly. Alternatively, email editorial-team@simplywallst.com