
 Nasdaq
 华尔街日报
华尔街日报Is American Airlines Stock Attractively Priced After Recent 28% Monthly Surge?
- If you are wondering whether American Airlines Group is a bargain or a value trap at current levels, this article will walk you through what the numbers are really saying about the stock.
- After a choppy stretch, the share price has climbed about 5.5% over the last week and 28.0% over the past month, even though it is still down 7.2% year to date and 6.5% over the last year.
- Recent headlines have focused on the airline sector's shifting demand outlook and ongoing efforts to manage costs and capacity more tightly, which helps explain some of the renewed interest in the stock. Broader travel industry trends and changing investor sentiment toward cyclical names are also contributing to American Airlines Group's recent price moves.
- On our valuation framework, American Airlines Group currently scores a 4 out of 6, which suggests it appears undervalued on most but not all metrics. Next we will break down those methods, before finishing with a more holistic way to think about what the stock may be worth.
Find out why American Airlines Group's -6.5% return over the last year is lagging behind its peers.
Approach 1: American Airlines Group Discounted Cash Flow (DCF) Analysis
A Discounted Cash Flow model estimates what a business is worth today by projecting the cash it can generate in the future and discounting those cash flows back to the present. For American Airlines Group, the model uses a 2 Stage Free Cash Flow to Equity approach, relying on analysts for the next few years and then extrapolating further out.
The company generated about $1.03 billion of free cash flow over the last twelve months, and analysts expect this to rise steadily over time. Simply Wall St projects free cash flow reaching roughly $2.76 billion by 2035, based on a gradually slowing growth path after the initial analyst forecast window. All cash flows are modelled in $, consistent with American Airlines Group's reporting currency.
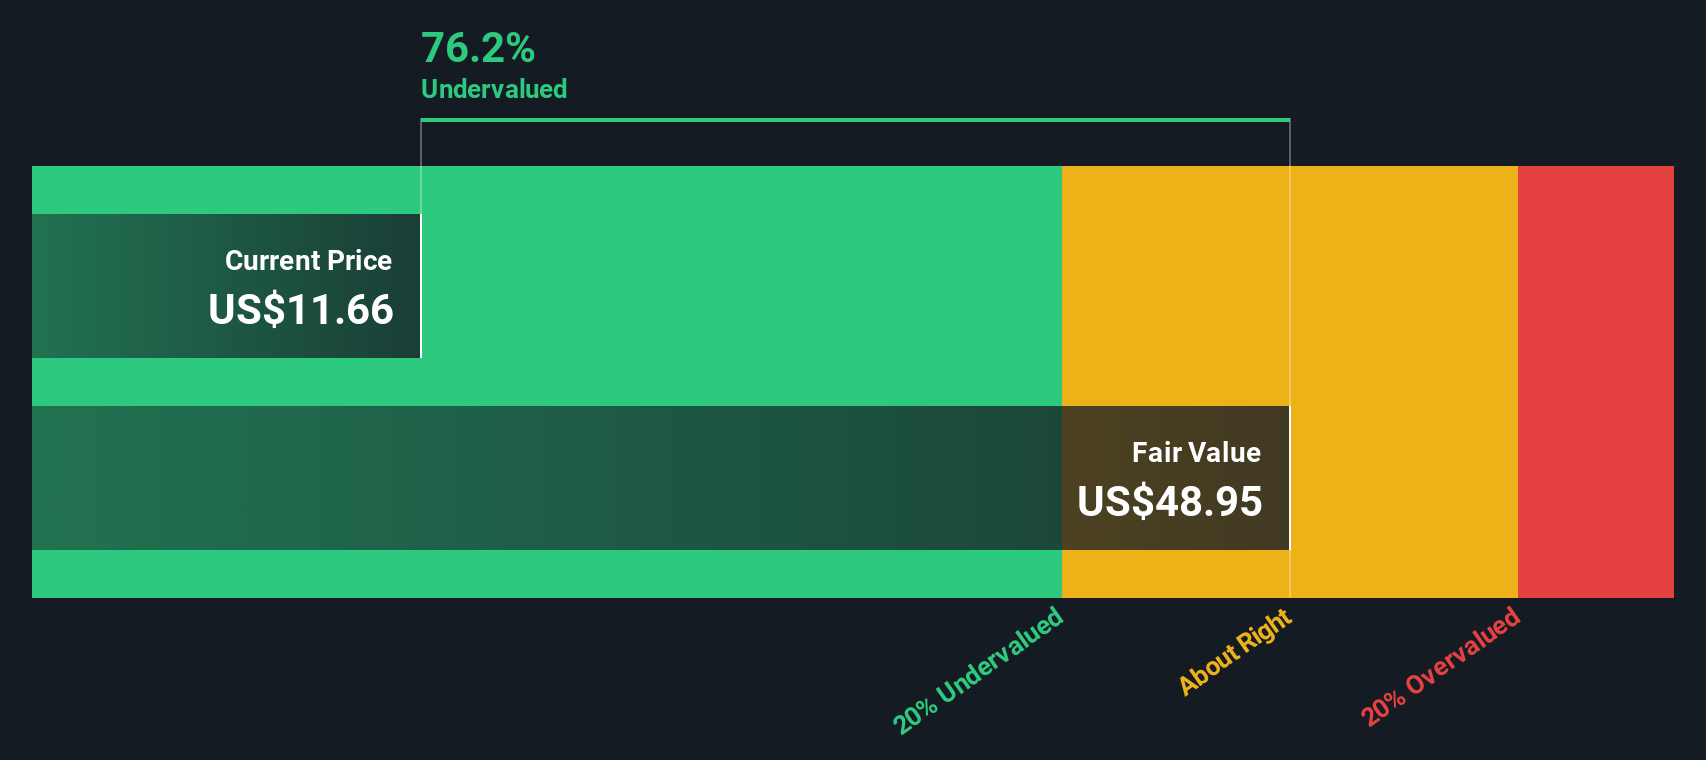
When these projected cash flows are discounted back using this framework, the resulting intrinsic value is about $29.85 per share. Compared with the current market price, this implies the stock is trading at roughly a 47.1% discount, suggesting potential upside if the cash flow assumptions play out.
Result: UNDERVALUED
Our Discounted Cash Flow (DCF) analysis suggests American Airlines Group is undervalued by 47.1%. Track this in your watchlist or portfolio, or discover 914 more undervalued stocks based on cash flows.
Approach 2: American Airlines Group Price vs Earnings
For profitable companies like American Airlines Group, the price to earnings, or PE, ratio is a useful way to gauge how much investors are willing to pay today for each dollar of current earnings. It naturally captures both the company’s profitability and what the market expects those earnings to do over time.
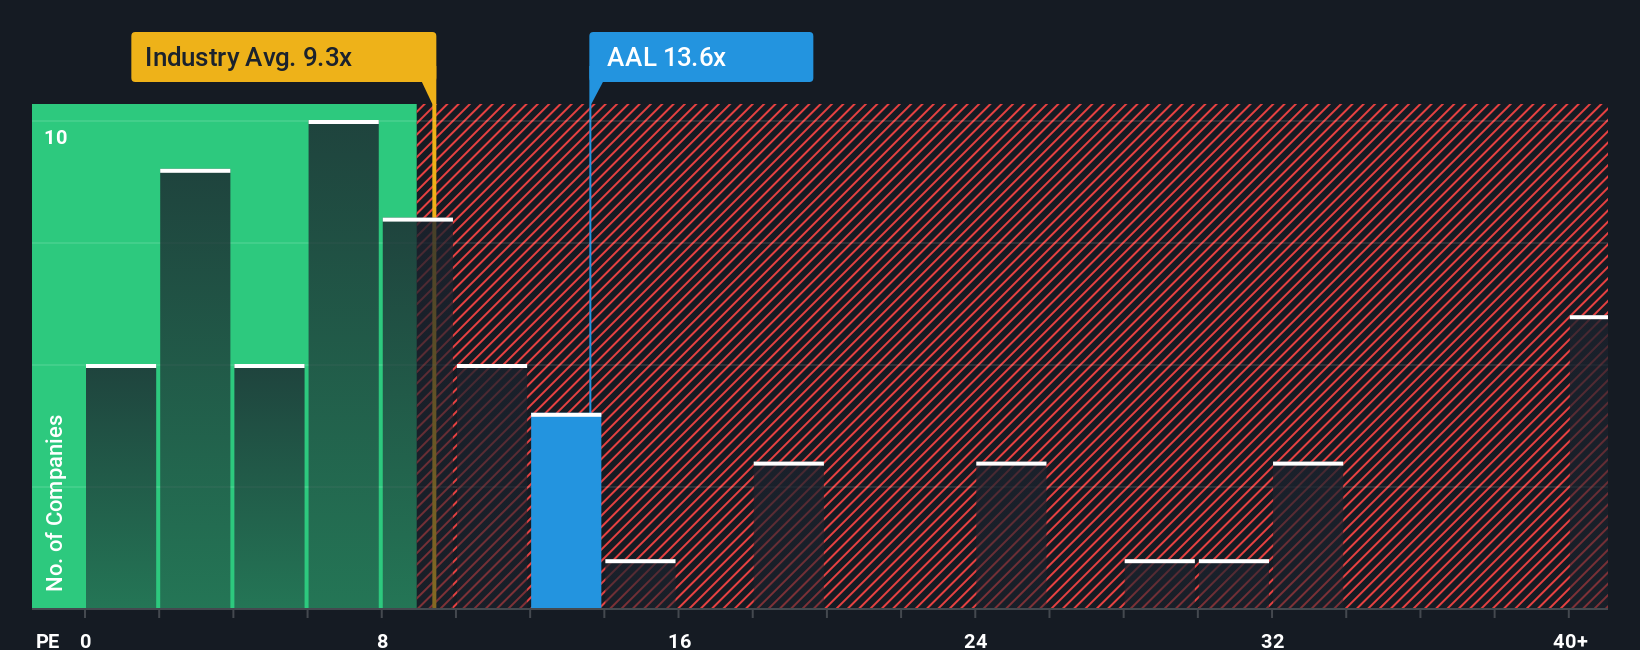
In general, faster growing and less risky businesses tend to trade on a higher “normal” PE. Slower growing or more volatile companies typically trade on lower multiples. American Airlines Group currently trades on a PE of about 17.3x, which is above the Airlines industry average of roughly 9.6x but below the broader peer group average of around 28.5x. That positioning suggests the market is assigning it a premium to the sector, but not an aggressive one relative to other comparables.
Simply Wall St’s Fair Ratio framework refines this further by estimating what PE the stock should trade on, given its specific earnings growth outlook, profit margins, industry, size and risk profile. For American Airlines Group, this Fair Ratio is about 24.5x, comfortably above the current 17.3x. On this basis, the stock appears undervalued relative to what a tailored, fundamentals based multiple would imply.
Result: UNDERVALUED
PE ratios tell one story, but what if the real opportunity lies elsewhere? Discover 1466 companies where insiders are betting big on explosive growth.
Upgrade Your Decision Making: Choose your American Airlines Group Narrative
Earlier we mentioned that there is an even better way to understand valuation, so let us introduce you to Narratives, a simple way to connect your view of American Airlines Group’s future with clear numbers for revenue, earnings, margins and fair value.
A Narrative is your story about the company, translated into a financial forecast that then flows through to a fair value estimate. Instead of starting with a multiple, you start with assumptions about demand, pricing, costs and balance sheet risk, and see what they imply for the share price.
On Simply Wall St, Narratives live in the Community page and are designed to be easy to use, helping millions of investors decide when to buy or sell by comparing their Fair Value to the current market Price and automatically updating when new earnings, news or guidance change the outlook.
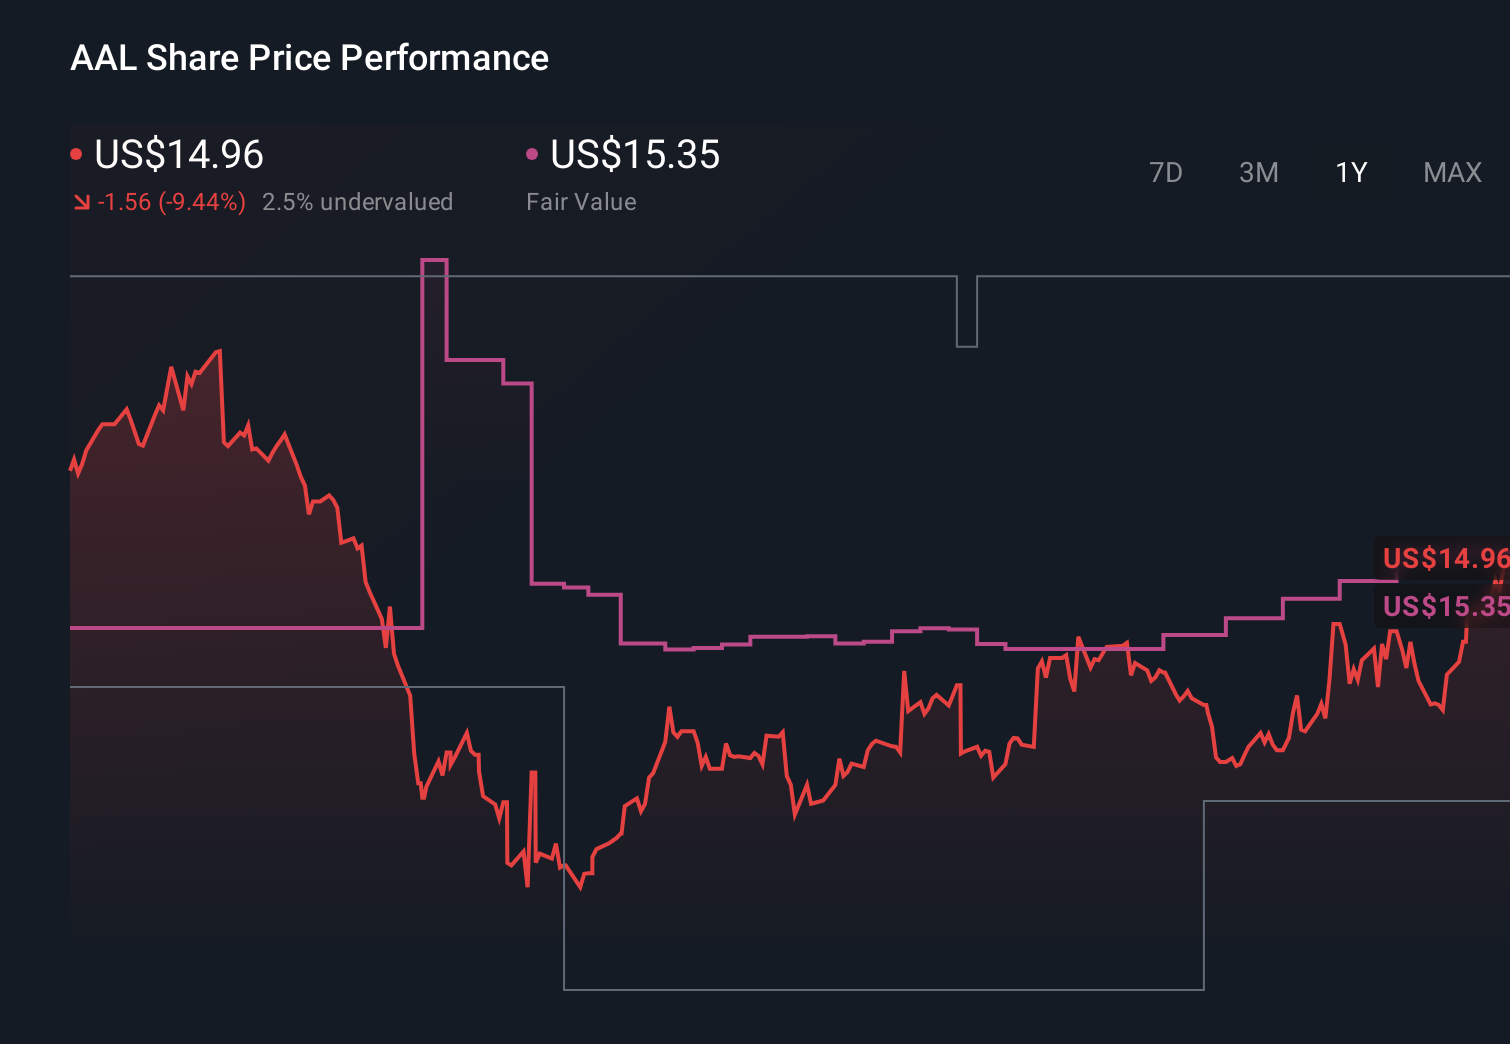
For example, one investor might build a cautious Narrative for American Airlines Group with a fair value near $10.61, while another more optimistic Narrative might support a fair value closer to $15.35. Seeing both side by side makes it clear which story you find more believable and what that means for your decision.
Do you think there's more to the story for American Airlines Group? Head over to our Community to see what others are saying!
This article by Simply Wall St is general in nature. We provide commentary based on historical data and analyst forecasts only using an unbiased methodology and our articles are not intended to be financial advice. It does not constitute a recommendation to buy or sell any stock, and does not take account of your objectives, or your financial situation. We aim to bring you long-term focused analysis driven by fundamental data. Note that our analysis may not factor in the latest price-sensitive company announcements or qualitative material. Simply Wall St has no position in any stocks mentioned.
Have feedback on this article? Concerned about the content? Get in touch with us directly. Alternatively, email editorial-team@simplywallst.com