
 Nasdaq
 华尔街日报
华尔街日报Has the Recent 26.9% Rally in V.F Made the Stock Expensive Again?
- If you are wondering whether V.F is a beaten-down bargain or a value trap at this point in the cycle, you are not alone. That is exactly what this breakdown is here to unpack.
- After a long slide, including a -73.7% return over 5 years and -14.5% over the last year, the stock has shown some life with a sharp 26.9% jump over the past month, despite being down -13.6% year to date and -5.3% in the last week.
- That recent rebound has come as investors focus on V.F's ongoing portfolio reshaping and strategic efforts to stabilize its core brands, while the market reassesses how much long-term damage the past few years of underperformance have really done. At the same time, shifting sentiment around consumer discretionary names and renewed attention on dividend sustainability have added extra volatility to the share price.
- Right now, V.F only scores a 1 out of 6 on our valuation checks, which suggests the stock only looks undervalued on one metric. Next, we will walk through the main valuation approaches side by side and then finish with a more nuanced way to think about what the market might really be pricing in.
V.F scores just 1/6 on our valuation checks. See what other red flags we found in the full valuation breakdown.
Approach 1: V.F Discounted Cash Flow (DCF) Analysis
A Discounted Cash Flow model estimates what a business is worth today by projecting the cash it could generate in the future and then discounting those cash flows back to the present.
For V.F, the latest twelve month Free Cash Flow is about $208.1 Million, and analysts expect this to rise meaningfully over time. Based on current forecasts and Simply Wall St extrapolations beyond the formal analyst window, Free Cash Flow is projected to reach around $679 Million by 2030, with a gradual moderation in growth thereafter as the company matures.
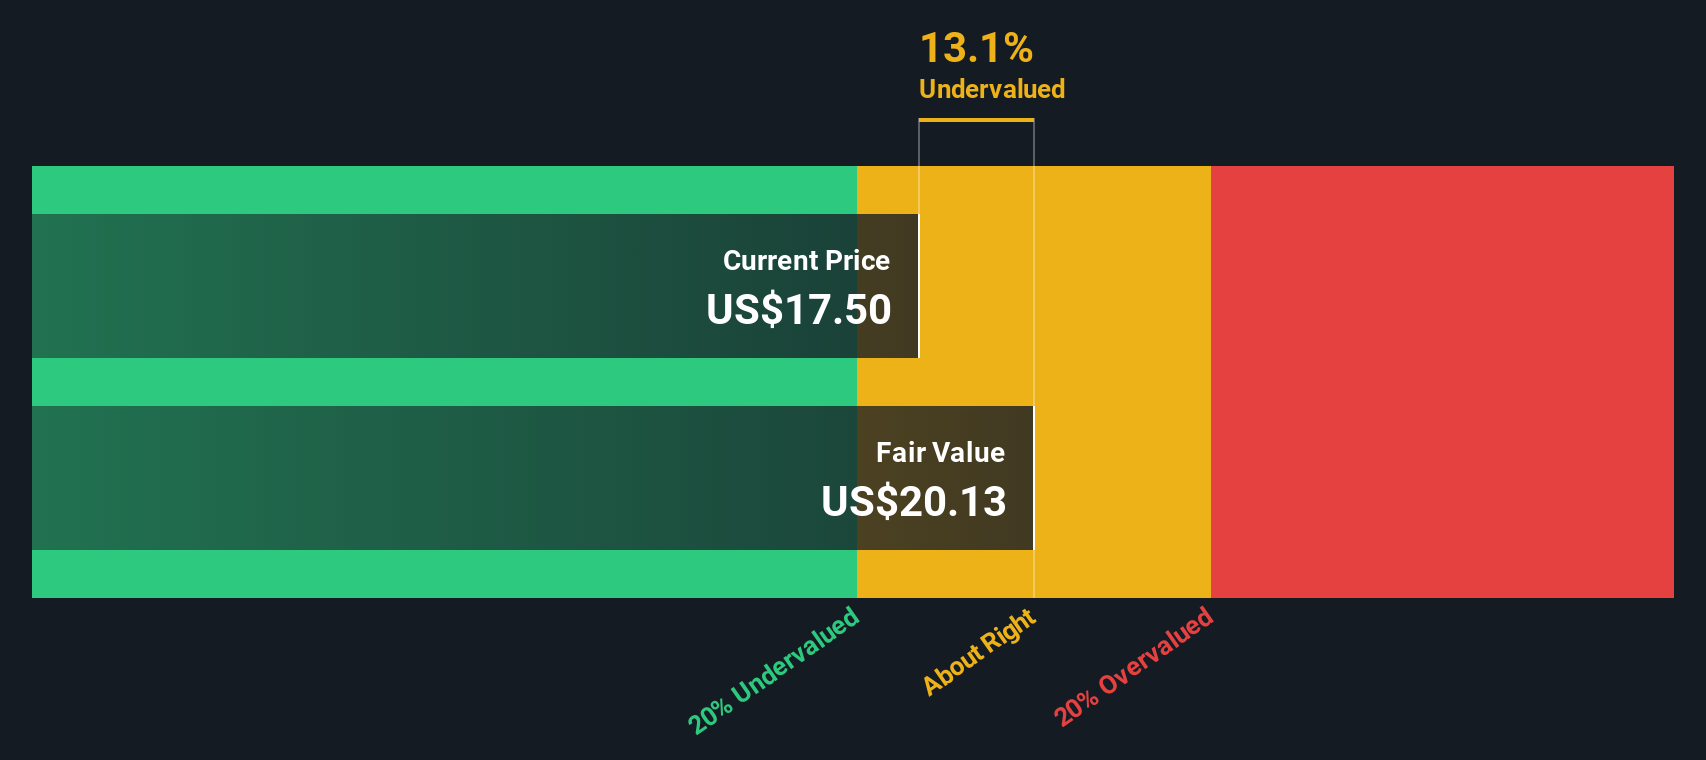
Using a 2 Stage Free Cash Flow to Equity model, these projected cash flows are discounted back to today to arrive at an estimated intrinsic value of roughly $20.42 per share. Compared with the current share price, this suggests V.F is trading at an 8.8% discount to its estimated fair value. This indicates a modest margin of safety rather than a deep bargain.
Result: ABOUT RIGHT
V.F is fairly valued according to our Discounted Cash Flow (DCF), but this can change at a moment's notice. Track the value in your watchlist or portfolio and be alerted on when to act.
Approach 2: V.F Price vs Earnings
For companies that are profitable, the Price to Earnings ratio is often the go to valuation yardstick, because it links what investors are paying today directly to the earnings the business is generating. A higher or lower PE can be justified depending on how quickly profits are expected to grow and how risky or cyclical those earnings are, so there is no single "right" number in isolation.
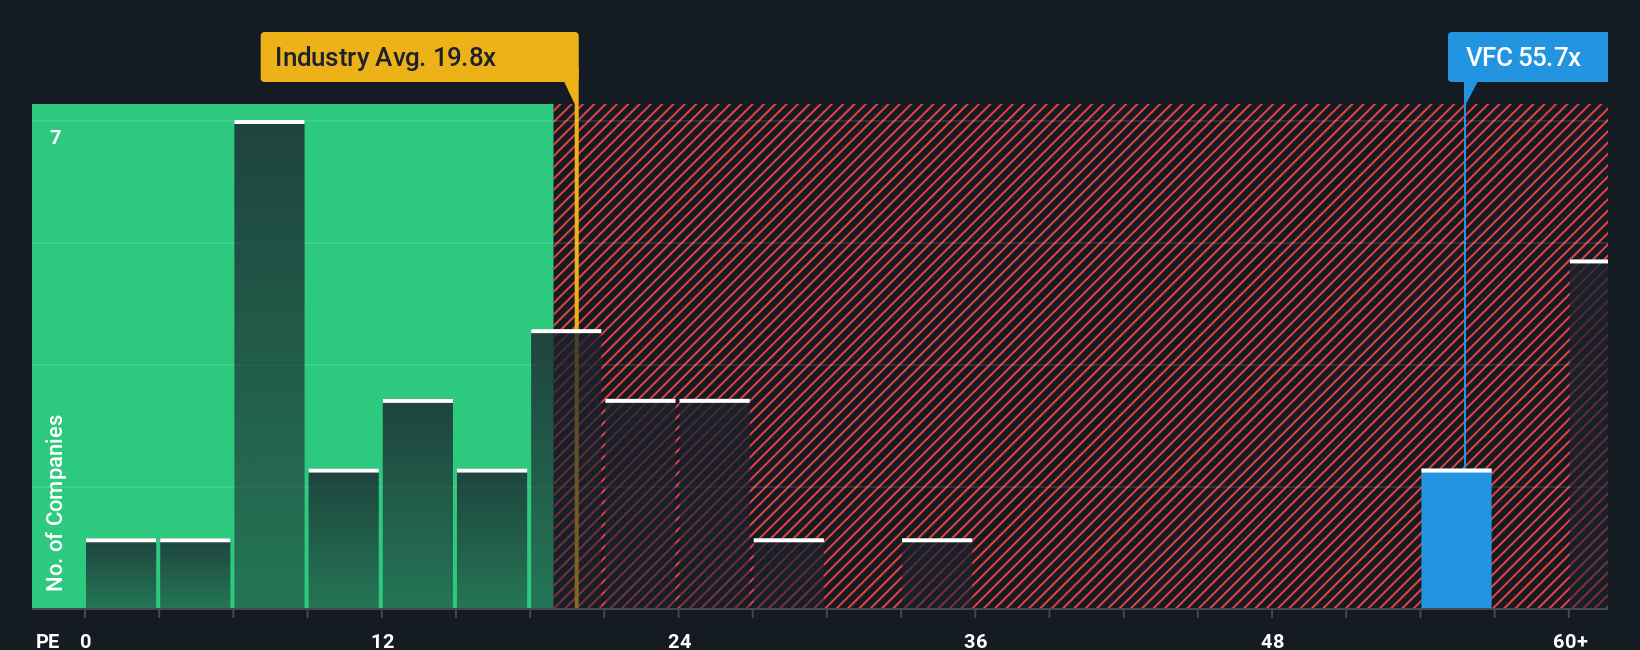
V.F currently trades on a PE of about 78.9x, which is far richer than both the Luxury industry average of roughly 20.3x and the broader peer group average of around 14.5x. To go a step further, Simply Wall St calculates a proprietary "Fair Ratio" that estimates what PE multiple the company should trade on, given its earnings growth outlook, margins, risk profile, industry and market cap. For V.F, that Fair Ratio is 28.2x, which is well below the current market multiple and therefore suggests the shares are pricing in more optimism than these fundamentals support.
Result: OVERVALUED
PE ratios tell one story, but what if the real opportunity lies elsewhere? Discover 1466 companies where insiders are betting big on explosive growth.
Upgrade Your Decision Making: Choose your V.F Narrative
Earlier we mentioned that there is an even better way to understand valuation, so let's introduce you to Narratives, which are simply the stories investors tell about a company that link their view of its future (revenue, earnings, and margins) to a financial forecast and then to a fair value estimate they can compare with the current share price.
On Simply Wall St's Community page, Narratives make this process easy and accessible, allowing you to capture your perspective on V.F in numbers, see how that translates into a fair value, and then decide whether the stock looks like a buy, hold, or sell at today’s price.
Because Narratives are dynamically updated when new information, such as earnings releases, guidance changes, news, or lawsuits hits the market, your fair value view adjusts alongside the story. This can help you avoid relying on stale assumptions.
For example, one V.F Narrative might lean bullish, assuming successful premiumization, improving margins and a fair value closer to the most optimistic analyst target of about $40. Another, more cautious Narrative might emphasize ongoing Vans weakness and legal risks, landing closer to the bearish end near $10. By comparing those ranges to the current price, you can see which story you find more convincing and how much potential upside or downside you are willing to accept.
Do you think there's more to the story for V.F? Head over to our Community to see what others are saying!

This article by Simply Wall St is general in nature. We provide commentary based on historical data and analyst forecasts only using an unbiased methodology and our articles are not intended to be financial advice. It does not constitute a recommendation to buy or sell any stock, and does not take account of your objectives, or your financial situation. We aim to bring you long-term focused analysis driven by fundamental data. Note that our analysis may not factor in the latest price-sensitive company announcements or qualitative material. Simply Wall St has no position in any stocks mentioned.
Have feedback on this article? Concerned about the content? Get in touch with us directly. Alternatively, email editorial-team@simplywallst.com