
 Nasdaq
 华尔街日报
华尔街日报Is OMRON’s Recent Share Rebound Justified by Its Current Valuation Metrics?
- If you are wondering whether OMRON is quietly turning into a value opportunity or remains a value trap, you are not alone. That is exactly what we are going to unpack here.
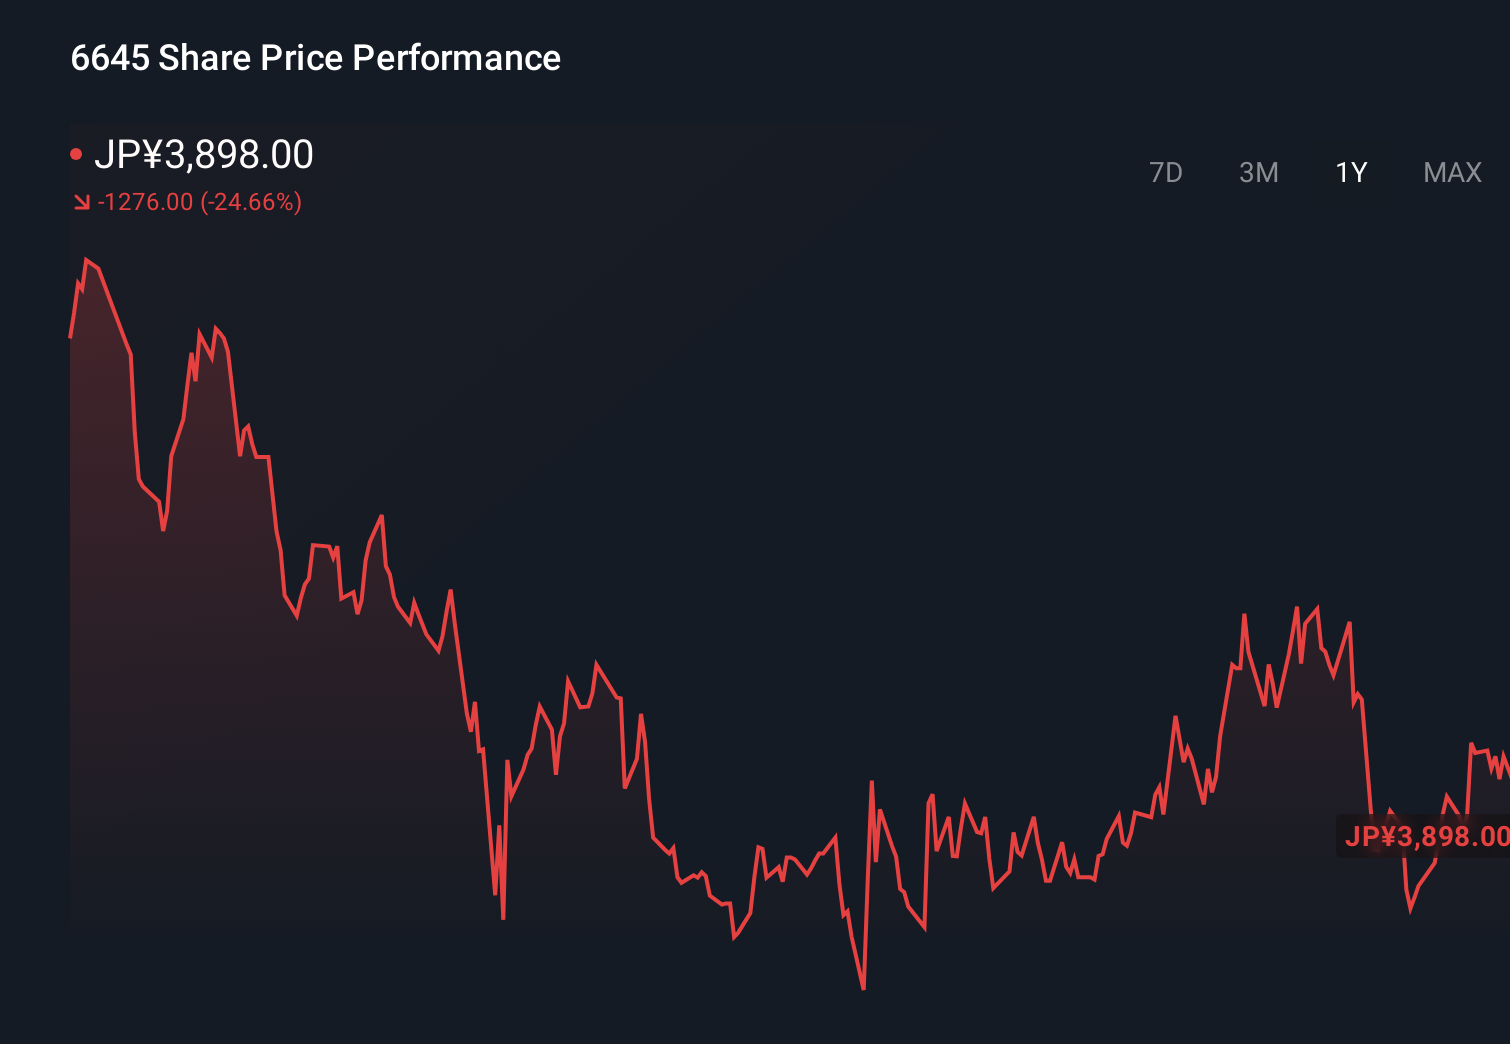
- Despite a tough backdrop with the share price down 24.4% year to date and 22.1% over the last 12 months, the stock has seen a 5.0% bounce over the past 30 days after a 5.0% pullback in just the last week.
- Recent market chatter has centered on OMRON's positioning in factory automation and healthcare equipment, as investors weigh how its sensor and control solutions will benefit from longer term automation and digitization trends. At the same time, headlines about global supply chain normalization and capital expenditure cycles in manufacturing have influenced how investors perceive both the risks and the potential upside for the business.
- Right now OMRON scores just 0 out of 6 on our undervaluation checks, which might surprise anyone assuming the weak long term share performance automatically makes it cheap. Next we will walk through the main valuation approaches, before finishing with a more nuanced way to think about what the market is really pricing in.
OMRON scores just 0/6 on our valuation checks. See what other red flags we found in the full valuation breakdown.
Approach 1: OMRON Discounted Cash Flow (DCF) Analysis
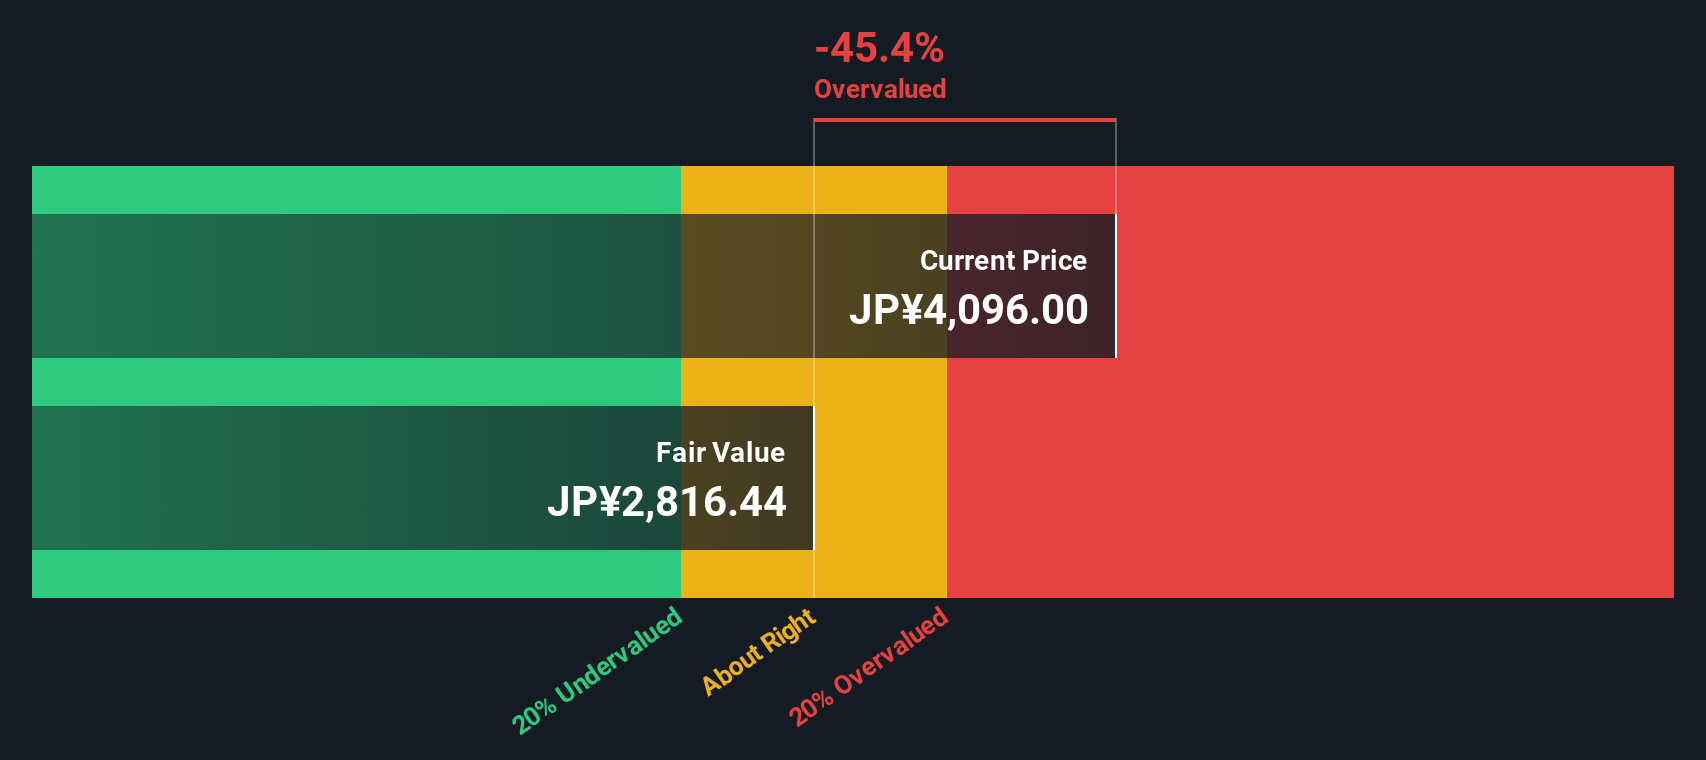
A Discounted Cash Flow model estimates what a business is worth today by projecting its future cash flows and then discounting them back to the present using a required rate of return. For OMRON, the model uses a 2 Stage Free Cash Flow to Equity approach, starting from last twelve months free cash flow of about ¥12.2 Billion and building up a path of future cash generation.
Analyst forecasts and subsequent extrapolations by Simply Wall St point to free cash flow rising to roughly ¥40.9 Billion by the 2030 fiscal year, before moderating in later years as growth slows. These projected cash flows are converted into today’s money and summed to arrive at an intrinsic value per share of around ¥2,556.
Compared with the current share price, the DCF suggests OMRON is about 52.5% overvalued. This implies the market is already pricing in a very optimistic cash flow trajectory and more.
Result: OVERVALUED
Our Discounted Cash Flow (DCF) analysis suggests OMRON may be overvalued by 52.5%. Discover 914 undervalued stocks or create your own screener to find better value opportunities.
Approach 2: OMRON Price vs Earnings
For a profitable business like OMRON, the price to earnings ratio is a straightforward way to gauge how much investors are willing to pay for each unit of current earnings. In general, faster growth and lower perceived risk justify a higher PE, while slower growth, cyclicality or higher risk usually call for a lower, more conservative multiple.
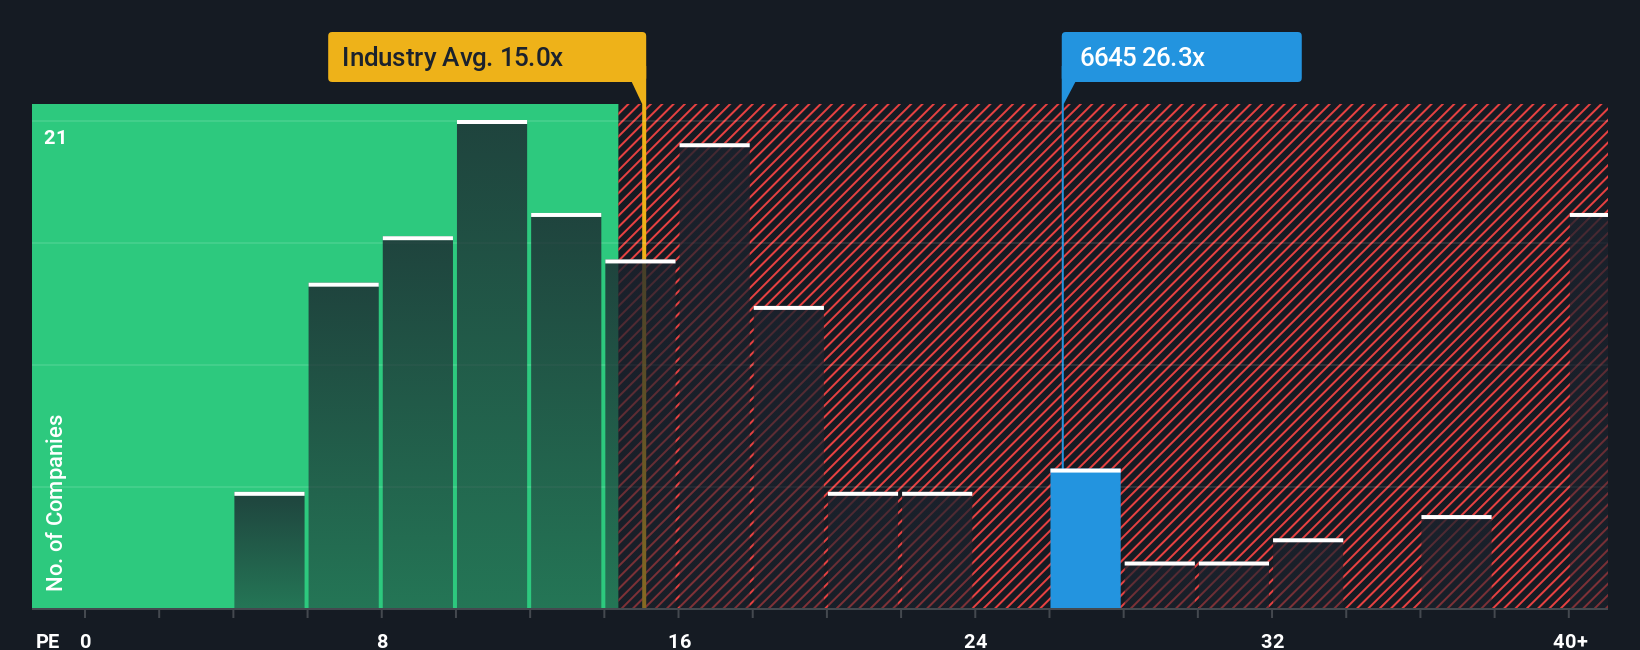
OMRON currently trades on about 26.8x earnings, which is meaningfully above the broader Electronic industry average of roughly 14.5x and also higher than the peer group average of around 24.8x. Simply Wall St adds another layer with its Fair Ratio metric of about 22.6x, which represents the PE one might expect given OMRON’s specific earnings growth profile, margins, industry, market cap and risk characteristics.
This Fair Ratio is more informative than a simple comparison with peers or the industry because it adjusts for how OMRON actually stacks up on fundamentals rather than assuming all companies deserve the same multiple. With the market paying 26.8x versus a Fair Ratio of 22.6x, the shares appear somewhat expensive on an earnings basis.
Result: OVERVALUED
PE ratios tell one story, but what if the real opportunity lies elsewhere? Discover 1466 companies where insiders are betting big on explosive growth.
Upgrade Your Decision Making: Choose your OMRON Narrative
Earlier we mentioned that there is an even better way to understand valuation, so let us introduce you to Narratives, a smarter way to connect your view of OMRON with the numbers behind it. A Narrative is simply your story about the company, translated into assumptions for future revenue, earnings and margins, which then flow into a fair value estimate. Instead of treating valuation as a fixed number, Narratives link OMRON’s business story to a forward looking financial forecast and then to what you believe the shares are really worth. On Simply Wall St, millions of investors build and share these Narratives on the Community page, making the tool both accessible and easy to use. Narratives also help you make more informed decisions about buying or selling by continuously comparing your Fair Value to the current market price, and they update automatically as new earnings, news or guidance change the outlook. For example, one OMRON Narrative might assume a rapid rebound in factory automation demand and arrive at a high fair value, while another assumes a prolonged capex slowdown and produces a much lower one.
Do you think there's more to the story for OMRON? Head over to our Community to see what others are saying!
This article by Simply Wall St is general in nature. We provide commentary based on historical data and analyst forecasts only using an unbiased methodology and our articles are not intended to be financial advice. It does not constitute a recommendation to buy or sell any stock, and does not take account of your objectives, or your financial situation. We aim to bring you long-term focused analysis driven by fundamental data. Note that our analysis may not factor in the latest price-sensitive company announcements or qualitative material. Simply Wall St has no position in any stocks mentioned.
Have feedback on this article? Concerned about the content? Get in touch with us directly. Alternatively, email editorial-team@simplywallst.com