
 Nasdaq
 华尔街日报
华尔街日报Can Redwire’s 46% Rally and New Space Contracts Justify Its Lofty Valuation?
- If you are wondering whether Redwire at around $8 is a bruised bargain or a value trap, you are not alone. That is exactly what we are going to unpack here.
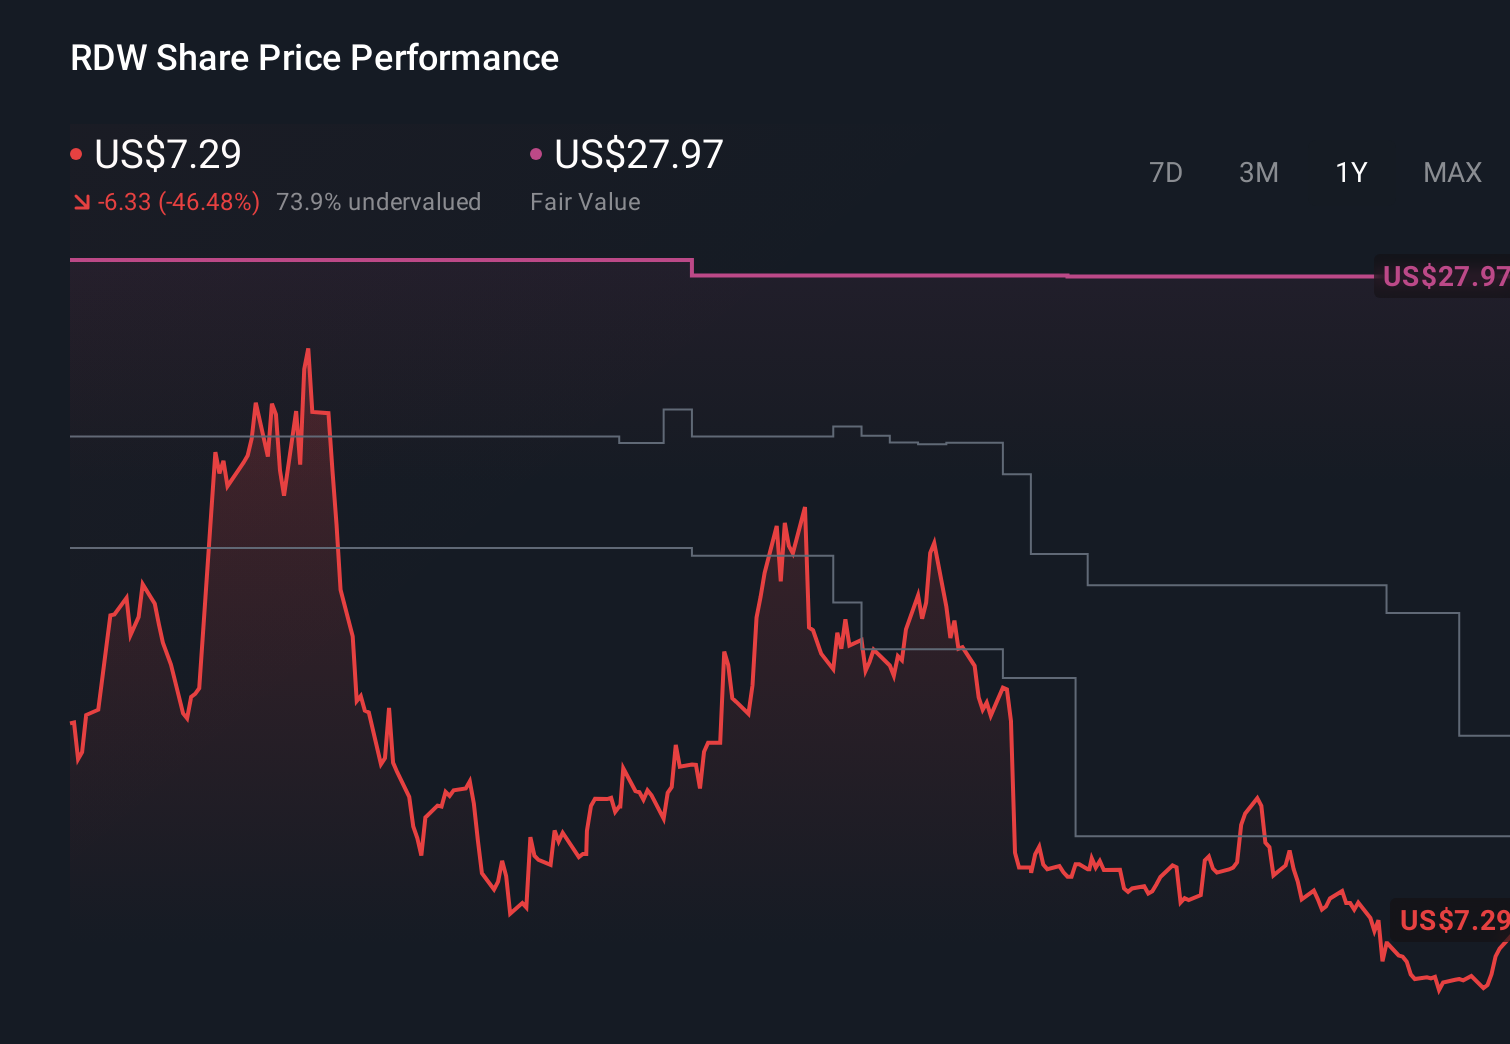
- The stock has bounced sharply in the short term, up 9.7% over the last week and 46.0% over the last month, but it is still down 53.1% year to date and 42.4% over the past year, even after a huge 316.7% gain over three years.
- Those kinds of swings have come alongside a steady stream of space infrastructure contract wins and strategic partnerships that have kept Redwire on investors' radar. At the same time, the broader space and defense theme has heated up, shifting how the market prices both opportunity and risk in names like this.
- Despite all that excitement, Redwire currently scores just 0/6 on our valuation checks, which means traditional metrics do not yet flag it as clearly undervalued. Next we will walk through what those valuation approaches are actually saying, and then circle back at the end to a more nuanced way to think about what the stock might really be worth.
Redwire scores just 0/6 on our valuation checks. See what other red flags we found in the full valuation breakdown.
Approach 1: Redwire Discounted Cash Flow (DCF) Analysis
A Discounted Cash Flow model estimates what a company might be worth by projecting its future cash flows and then discounting those back into today’s dollars. For Redwire, the model starts from its latest twelve month Free Cash Flow of roughly $159.4 Million in the red, highlighting that the business is still cash hungry rather than cash generative.
Analysts see a sharp swing into positive territory, with Free Cash Flow projected at about $60.8 Million in 2026 and $5.8 Million in 2027, all in $. Beyond those years, Simply Wall St extrapolates a steep slowdown and then small negative cash flows through 2035, underlining how uncertain and lumpy Redwire’s cash profile could be over a full decade.
When all of those projected cash flows are discounted back to today using a 2 Stage Free Cash Flow to Equity model, the intrinsic value comes out to roughly $0.37 per share. Versus the current share price near $8, that implies the stock is about 2077.0% above the DCF estimate, which places it firmly in “aggressively priced” territory on this metric alone.
Result: OVERVALUED
Our Discounted Cash Flow (DCF) analysis suggests Redwire may be overvalued by 2077.0%. Discover 914 undervalued stocks or create your own screener to find better value opportunities.
Approach 2: Redwire Price vs Sales
For companies like Redwire that are still working toward consistent profitability, the Price to Sales ratio is often a more practical yardstick than earnings based metrics. Sales are generally less volatile than profits at this stage, so they can give a cleaner snapshot of how much investors are willing to pay for each dollar of revenue.
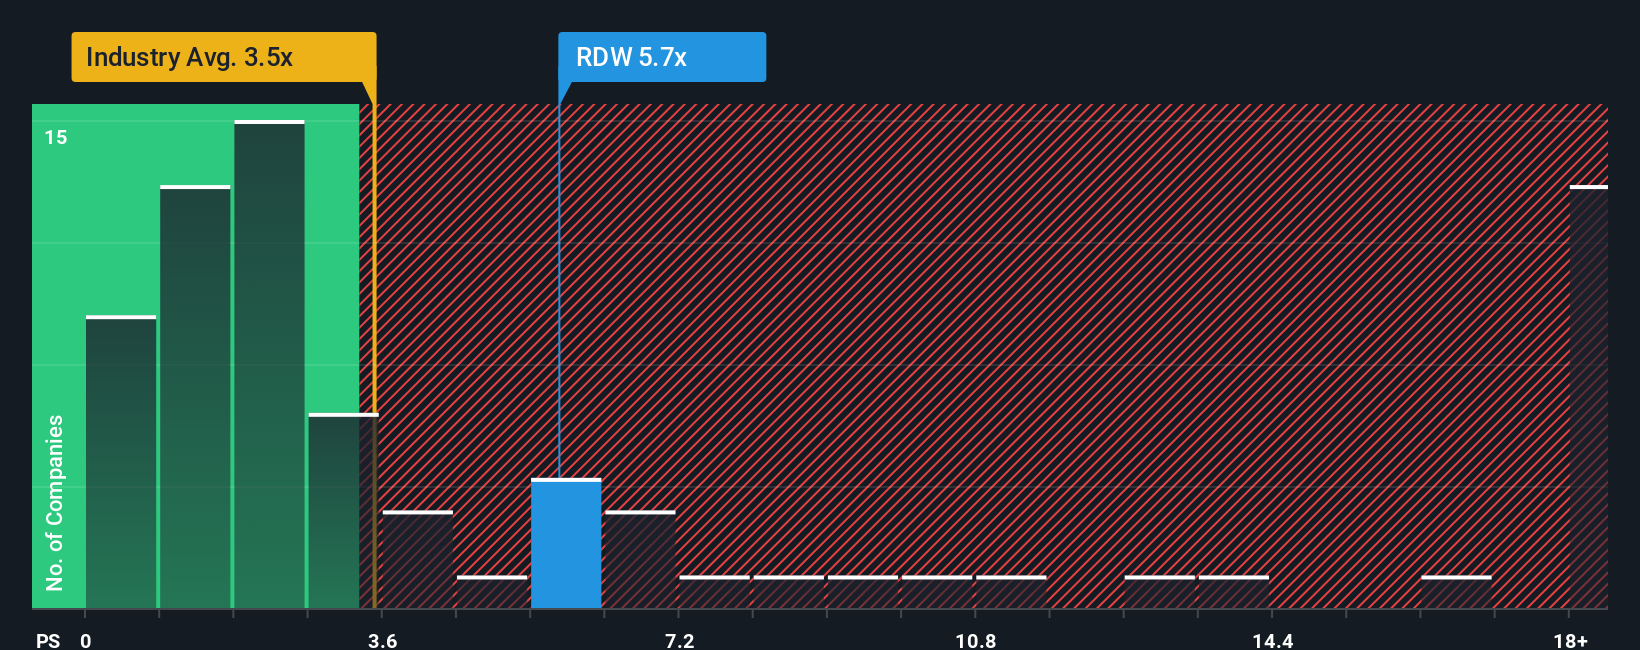
In broad terms, higher growth and lower risk tend to justify a richer multiple, while slower growth or higher uncertainty usually call for a discount. Redwire currently trades on a Price to Sales ratio of about 4.46x, which is above both the Aerospace and Defense industry average of roughly 3.01x and the peer group average of around 1.80x.
Simply Wall St distills these moving parts into a single “Fair Ratio,” which is the Price to Sales multiple that would be reasonable given Redwire’s growth outlook, margins, risk profile, size and industry. For Redwire, that Fair Ratio is estimated at about 1.68x, which is well below the current 4.46x. On this basis, even after accounting for its growth potential and sector dynamics, the shares appear to be priced ahead of fundamentals.
Result: OVERVALUED
PS ratios tell one story, but what if the real opportunity lies elsewhere? Discover 1466 companies where insiders are betting big on explosive growth.
Upgrade Your Decision Making: Choose your Redwire Narrative
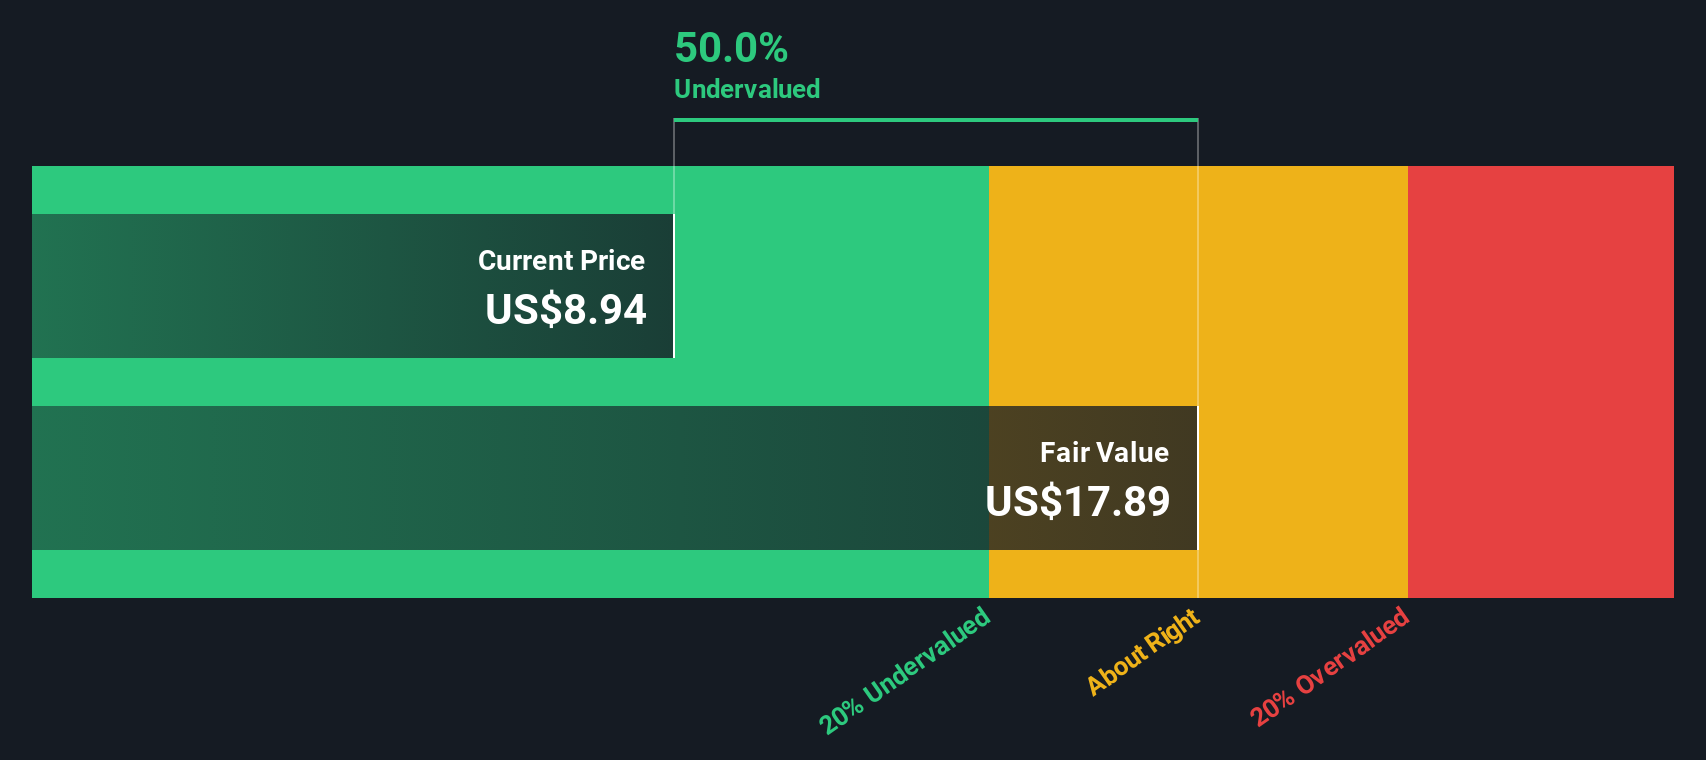
Earlier we mentioned that there is an even better way to understand valuation, so let us introduce you to Narratives, a simple tool on Simply Wall St’s Community page that lets you attach your own story about Redwire’s future (your assumptions for revenue growth, margins and fair value) to a structured financial forecast. You can compare that resulting fair value to today’s share price to decide whether to buy, hold or sell, and then have that view dynamically updated as new news or earnings arrive. For example, one optimistic investor might build a Narrative that sees Redwire’s fair value closer to the most bullish target of $28.00 based on accelerating government space orders and successful integration of acquisitions. A more cautious investor might anchor their Narrative around the $10.00 low target because they are more concerned about contract risk, industry consolidation and execution. Both perspectives can coexist and evolve in real time as new data comes in.
Do you think there's more to the story for Redwire? Head over to our Community to see what others are saying!
This article by Simply Wall St is general in nature. We provide commentary based on historical data and analyst forecasts only using an unbiased methodology and our articles are not intended to be financial advice. It does not constitute a recommendation to buy or sell any stock, and does not take account of your objectives, or your financial situation. We aim to bring you long-term focused analysis driven by fundamental data. Note that our analysis may not factor in the latest price-sensitive company announcements or qualitative material. Simply Wall St has no position in any stocks mentioned.
Have feedback on this article? Concerned about the content? Get in touch with us directly. Alternatively, email editorial-team@simplywallst.com