
 Nasdaq
 华尔街日报
华尔街日报Is Medtronic Fairly Priced After Its Portfolio Streamlining and Robotics Growth Push in 2025?
- If you have been wondering whether Medtronic is still a buy at around $98 a share, you are not alone. This article is designed to unpack what that price really implies about the company’s value.
- The stock is down about 1.2% over the last week and 1.7% over the last month, but it is still up 22.9% year to date and 25.7% over the past year, which signals a meaningful shift in how the market is viewing its long term prospects.
- Recent headlines have focused on Medtronic’s push to streamline its portfolio and focus on higher growth, higher margin medical technologies, a strategy that has caught the attention of long term investors. At the same time, regulatory updates and product approvals in areas like cardiac and diabetes care have reinforced the idea that Medtronic is positioning itself for durable growth rather than short lived momentum.
- On our framework, Medtronic currently scores a 4 out of 6 on valuation, reflecting a mix of undervaluation signals alongside a few metrics that look more fairly priced. Next, we will walk through different valuation approaches to see what is driving that score, and we will finish with a more intuitive way to think about Medtronic’s long term value story beyond the numbers alone.
Approach 1: Medtronic Discounted Cash Flow (DCF) Analysis
A Discounted Cash Flow model estimates what a company is worth today by projecting the cash it can generate in the future and then discounting those cash flows back to their value in today’s dollars.
For Medtronic, the model starts with last twelve month free cash flow of about $5.3 billion and uses analyst forecasts for the next few years, then extends those trends further out. By 2028, free cash flow is projected to reach roughly $7.3 billion, and Simply Wall St extrapolates this out to around $10.2 billion by 2035, with growth rates gradually moderating over time.
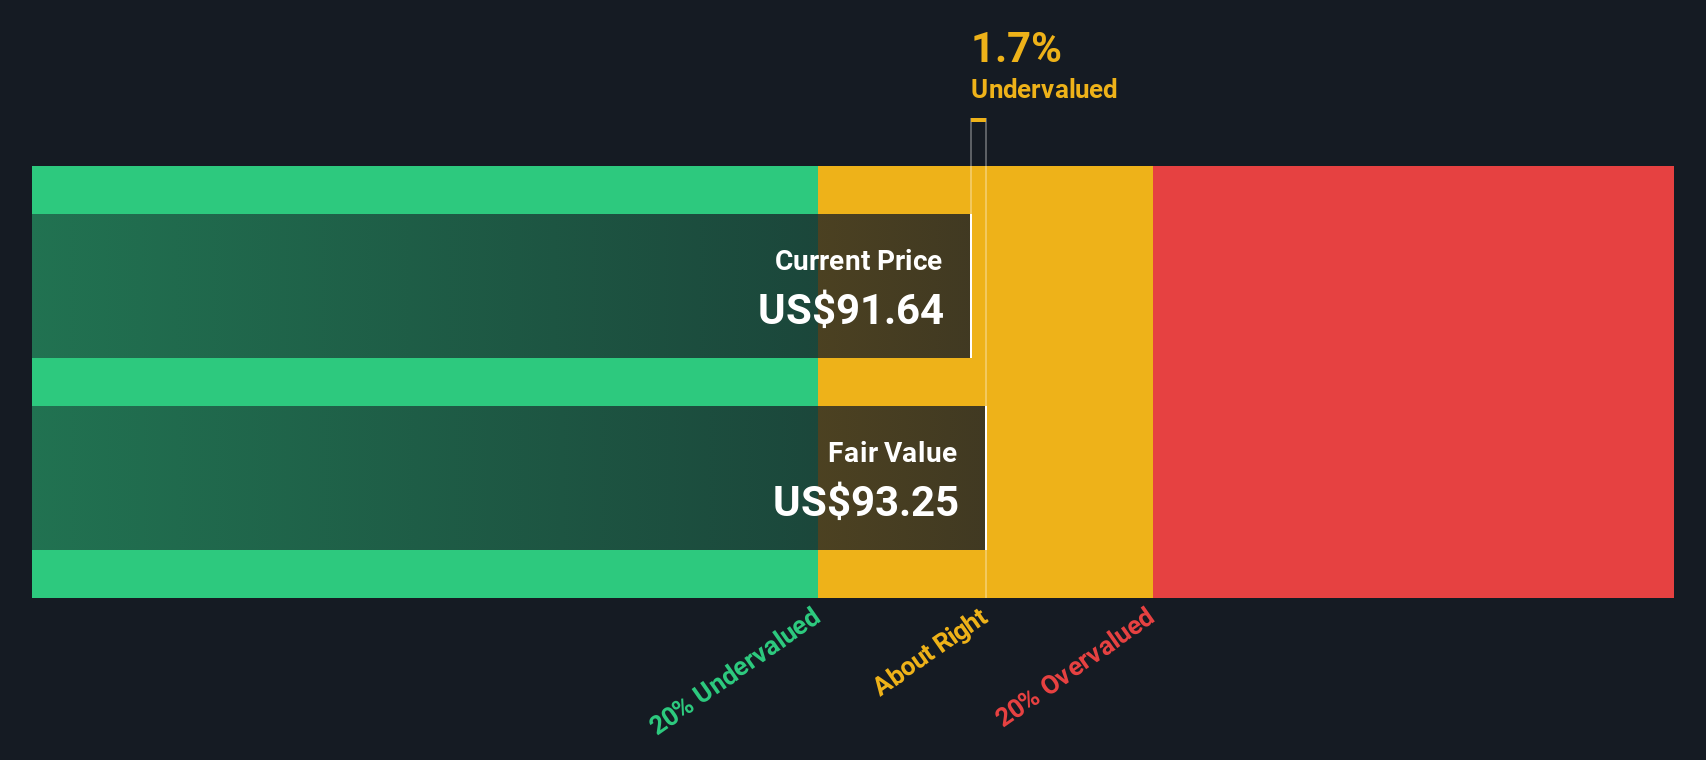
Aggregating and discounting these projected cash flows using a 2 Stage Free Cash Flow to Equity framework leads to an estimated intrinsic value of about $104.21 per share. Compared with the current price around $98, the model suggests Medtronic is trading at roughly a 5.4% discount to its DCF value. This points to the shares being very close to fairly valued, with a slight upside bias.
Result: ABOUT RIGHT
Medtronic is fairly valued according to our Discounted Cash Flow (DCF), but this can change at a moment's notice. Track the value in your watchlist or portfolio and be alerted on when to act.
Approach 2: Medtronic Price vs Earnings
For a mature, consistently profitable business like Medtronic, the price to earnings, or PE, ratio is a natural way to judge value because it links the share price directly to the earnings investors are paying for today.
What counts as a fair PE depends on how fast earnings are expected to grow and how risky those earnings are. Faster, more reliable growth usually justifies a higher PE, while slower or more uncertain growth typically deserves a lower one.
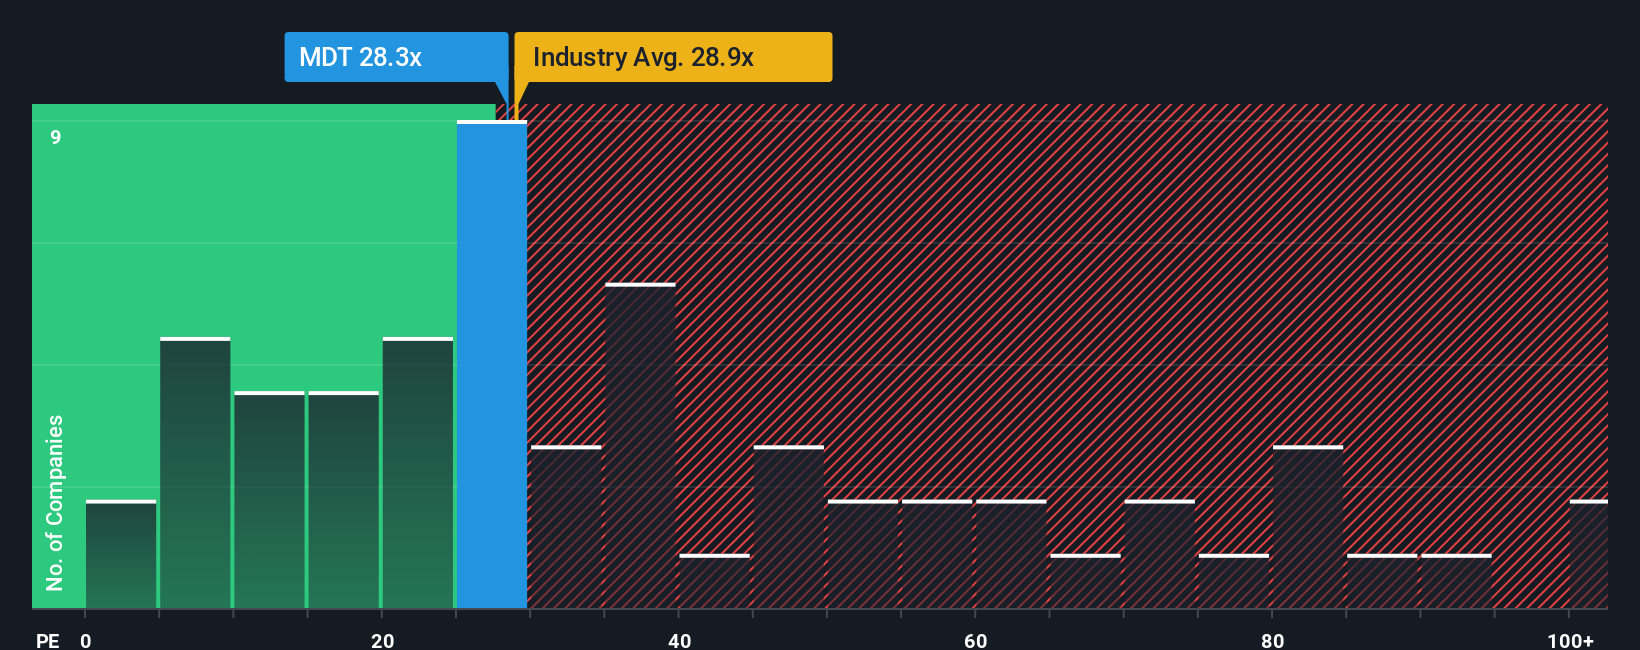
Medtronic currently trades on a PE of about 26.5x, which is below the broader medical equipment industry average of roughly 30.6x and well under the peer average near 46.6x. Simply Wall St also calculates a proprietary Fair Ratio of 32.0x for Medtronic, which reflects its specific earnings growth outlook, industry positioning, profit margins, market cap and risk profile.
This Fair Ratio is more tailored than a simple comparison with industry or peer averages because it adjusts for Medtronic’s own fundamentals rather than assuming all companies deserve the same multiple. With the stock at 26.5x versus a Fair Ratio of 32.0x, Medtronic screens as modestly undervalued on earnings.
Result: UNDERVALUED
PE ratios tell one story, but what if the real opportunity lies elsewhere? Discover 1466 companies where insiders are betting big on explosive growth.
Upgrade Your Decision Making: Choose your Medtronic Narrative
Earlier we mentioned that there is an even better way to understand valuation, so let us introduce you to Narratives, a simple way for you to connect your view of Medtronic’s story with a concrete forecast for its future revenue, earnings and margins, and then translate that into a Fair Value you can compare to today’s share price.
On Simply Wall St’s Community page, used by millions of investors, a Narrative is your own structured storyline for a company. In that storyline, you spell out what you think will drive growth, profitability and risk, and the platform turns that story into a dynamic financial model that updates as new earnings, news and guidance come through.
This makes buy and sell decisions more intuitive because you can quickly see whether your Fair Value is above or below the current price and how much of that gap is explained by differences in growth, margins or the discount rate you are using.
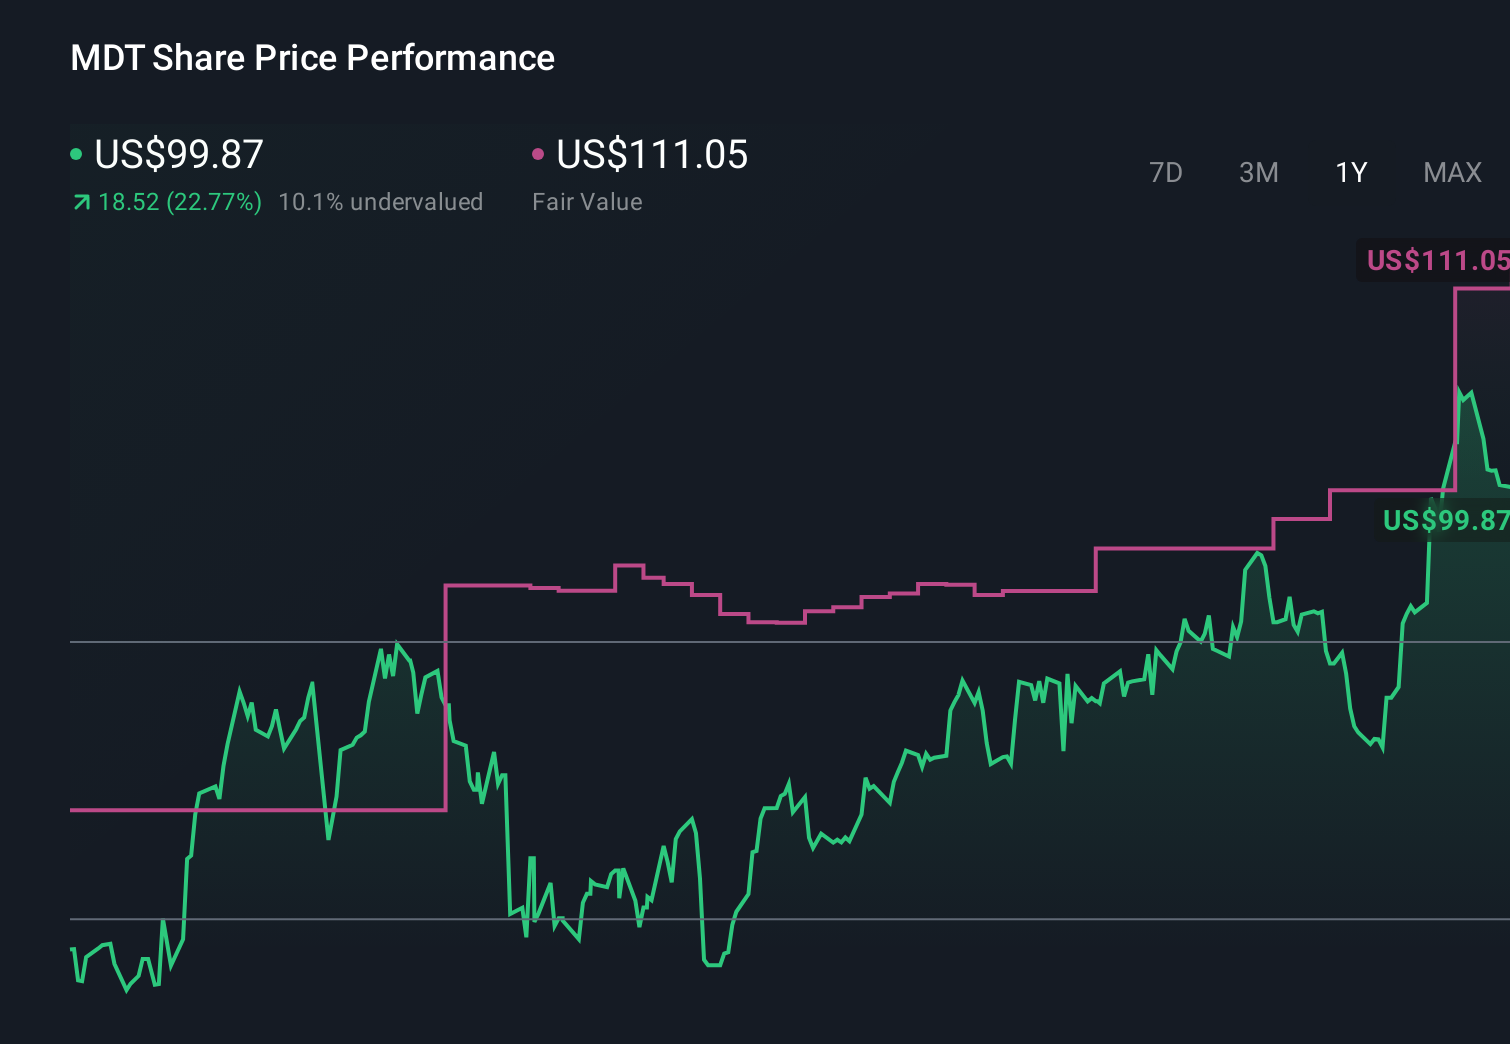
For example, one Medtronic Narrative on the platform currently estimates Fair Value at about $95 per share, while another sees upside closer to $111. These reflect two very different but clearly defined perspectives on its robotics pipeline, diabetes execution and long term margin potential.
For Medtronic however we will make it really easy for you with previews of two leading Medtronic Narratives:
Fair value: $111.05 per share
Implied undervaluation: 11.2% vs the latest close around $98.63
Forecast revenue growth: 5.79% per year
- Assumes structural demand from chronic diseases and digital health, robotics and AI enabled devices will support steady mid single digit revenue growth and market share gains.
- Expects margins to improve as Medtronic reshapes its portfolio, spins off Diabetes, tightens costs and leans into higher growth, higher margin cardiovascular and other innovation led franchises.
- Sees execution risks in new product launches and the Diabetes separation, but judges them manageable relative to the long term earnings and valuation upside implied by a stronger pipeline.
Fair value: $95.00 per share
Implied overvaluation: 3.8% vs the latest close around $98.63
Forecast revenue growth: 5.15% per year
- Highlights that despite a diversified portfolio, competitive pressure in cardiovascular, robotics and diabetes, along with hospital pricing scrutiny, could cap growth and compress margins.
- Emphasizes ongoing challenges in the Diabetes segment, regulatory and recall risks and the potential for supply chain or macro shocks to undermine the investment case.
- Argues that while Medtronic is financially resilient and innovative, the current share price already discounts much of the upside from robotics, AI and emerging market growth, leaving limited margin of safety.
Do you think there's more to the story for Medtronic? Head over to our Community to see what others are saying!
This article by Simply Wall St is general in nature. We provide commentary based on historical data and analyst forecasts only using an unbiased methodology and our articles are not intended to be financial advice. It does not constitute a recommendation to buy or sell any stock, and does not take account of your objectives, or your financial situation. We aim to bring you long-term focused analysis driven by fundamental data. Note that our analysis may not factor in the latest price-sensitive company announcements or qualitative material. Simply Wall St has no position in any stocks mentioned.
Have feedback on this article? Concerned about the content? Get in touch with us directly. Alternatively, email editorial-team@simplywallst.com