
 Nasdaq
 华尔街日报
华尔街日报Is Pilgrim's Pride Still Attractive After Big Multi Year Share Price Gains?
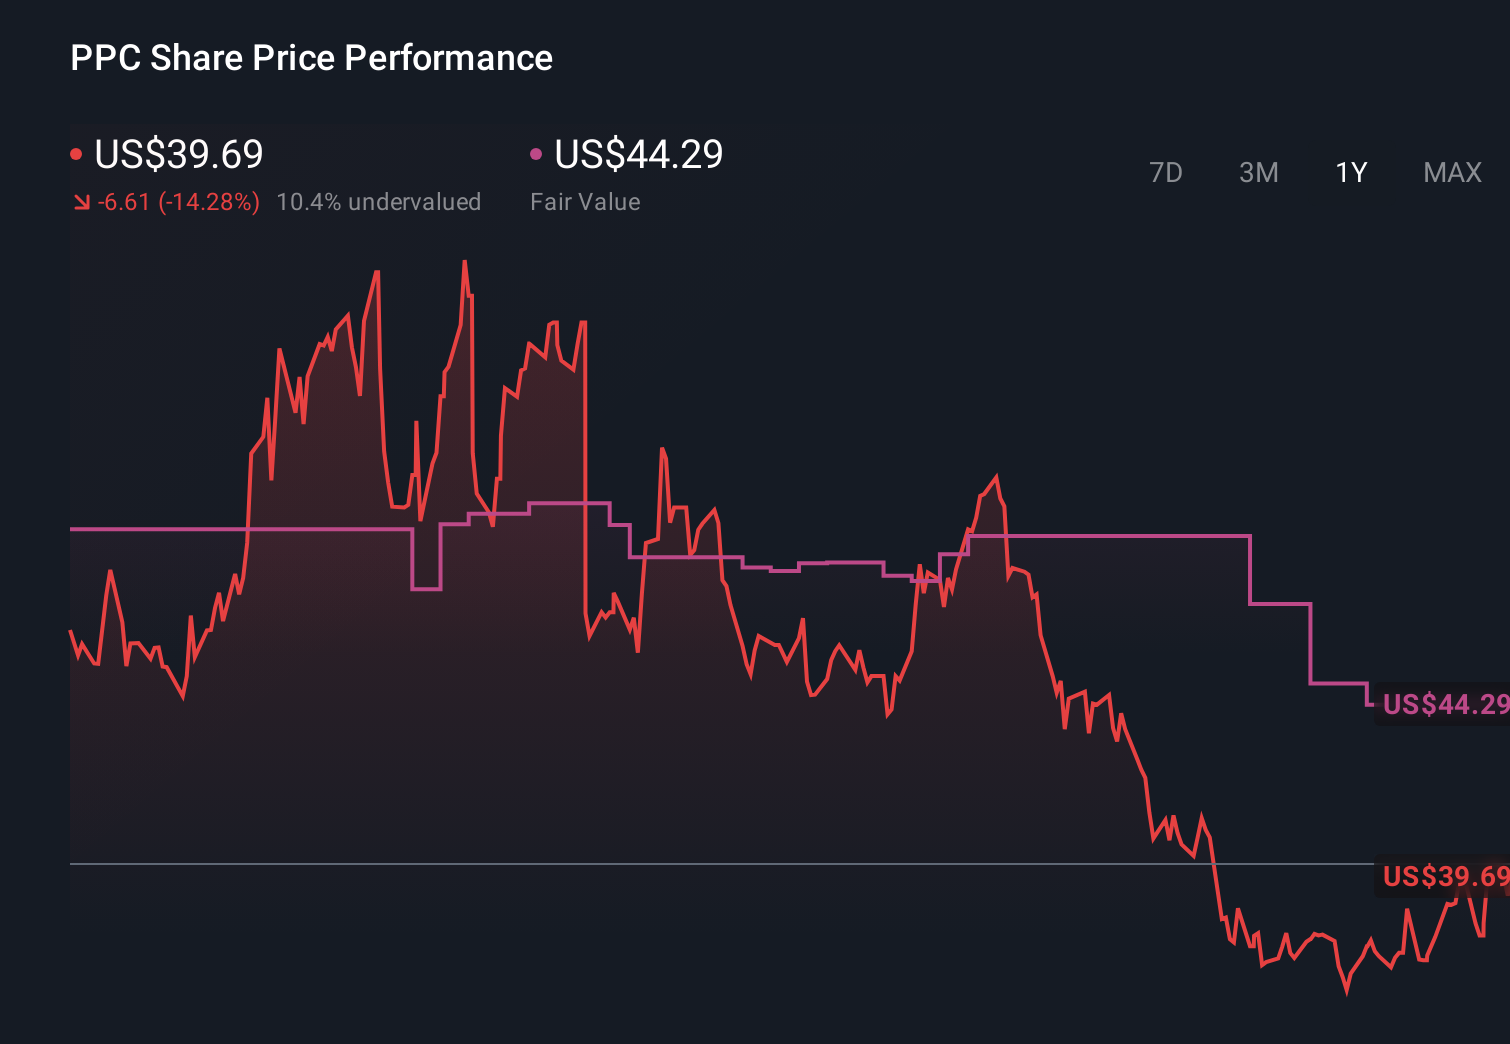
- Whether you are wondering if Pilgrim's Pride at around $39 a share is still a bargain or if the easy money has already been made, this breakdown is designed to give you a clear, valuation focused view of where the stock currently stands.
- The share price has slipped about 1.3% over the last week but is still up 4.9% over the past month. When you zoom out to 3 and 5 years, the stock has delivered gains of 95.6% and 140.6% respectively, even though it is roughly flat over the last year and down 16.5% year to date.
- Recent moves in the stock have played out against a backdrop of ongoing consolidation in the global protein industry and shifting consumer demand toward value oriented, at home meals. Pilgrim's Pride has been in focus as investors consider how well the company can navigate volatile input costs, changing export dynamics, and evolving retailer relationships.
- On our checklist of six valuation tests, Pilgrim's Pride scores a 3 out of 6 for being undervalued. This suggests the market may only be partially convinced by its fundamentals. Next, we will walk through the standard valuation approaches investors use, then finish with a more holistic way to judge what the stock may be worth.
Find out why Pilgrim's Pride's 0.9% return over the last year is lagging behind its peers.
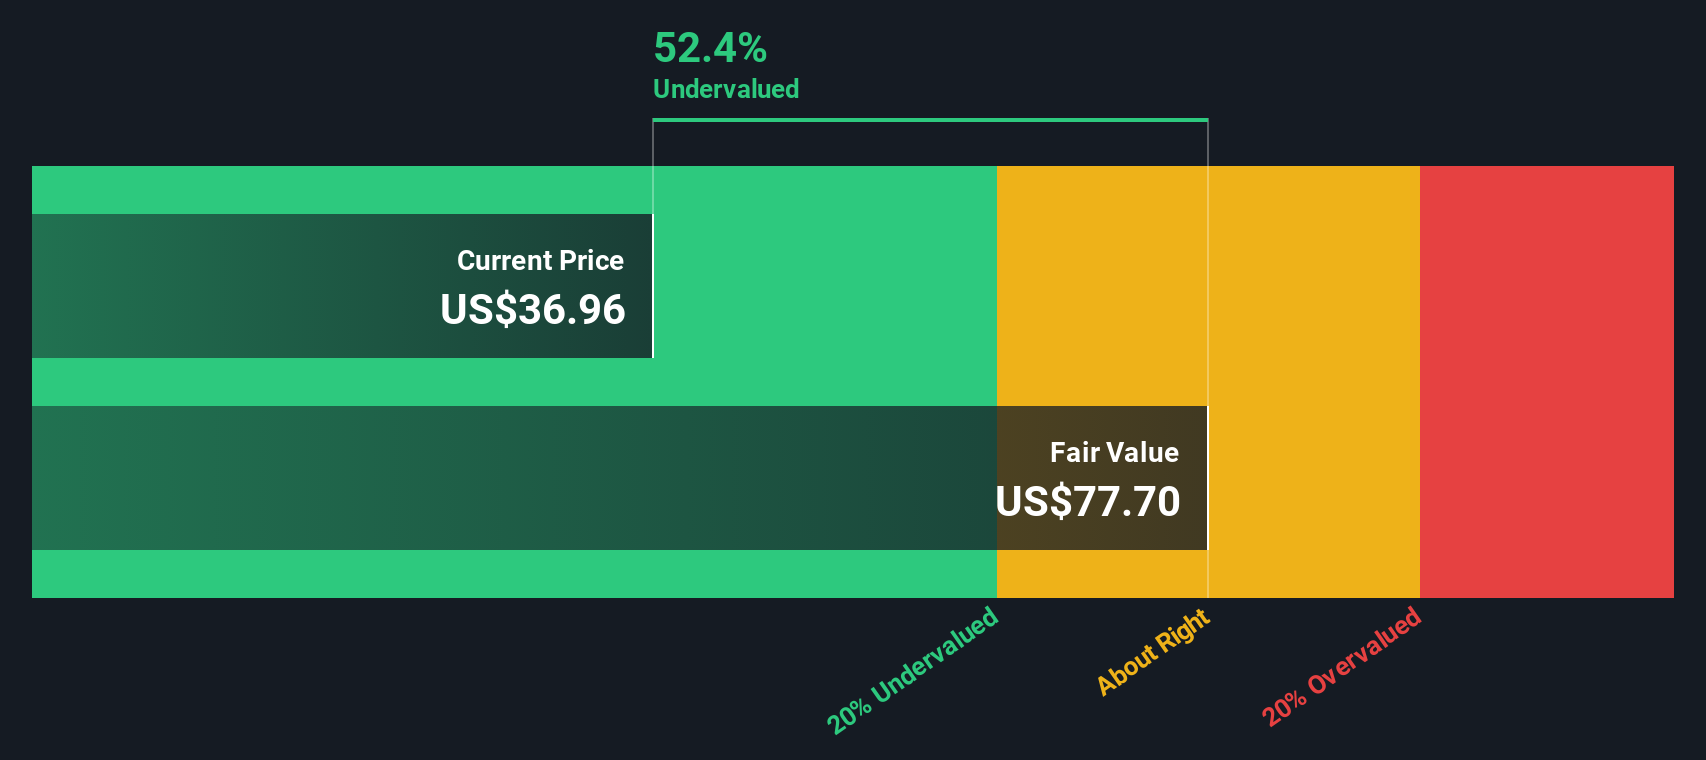
Approach 1: Pilgrim's Pride Discounted Cash Flow (DCF) Analysis
A Discounted Cash Flow model projects a company’s future cash flows and then discounts them back to today in order to estimate what the business is worth right now.
Pilgrim's Pride generated about $877.9 Million in free cash flow over the last twelve months, in $. Analysts expect free cash flow to be around $31 Million in 2026, and the model then extrapolates further declines over the following years, with projected free cash flow of roughly $4.5 Million by 2035 according to Simply Wall St estimates. These shrinking cash flows are fed into a 2 Stage Free Cash Flow to Equity model, which places more weight on the nearer term before assuming a steadier long run pattern.
On this basis, the DCF model implies an intrinsic value of about $0.57 per share for Pilgrim's Pride, compared with a market price around $39. That gap translates into an implied overvaluation of roughly 6795.5%, suggesting the market is pricing in far stronger and more durable cash flows than this model assumes.
Result: OVERVALUED
Our Discounted Cash Flow (DCF) analysis suggests Pilgrim's Pride may be overvalued by 6795.5%. Discover 914 undervalued stocks or create your own screener to find better value opportunities.
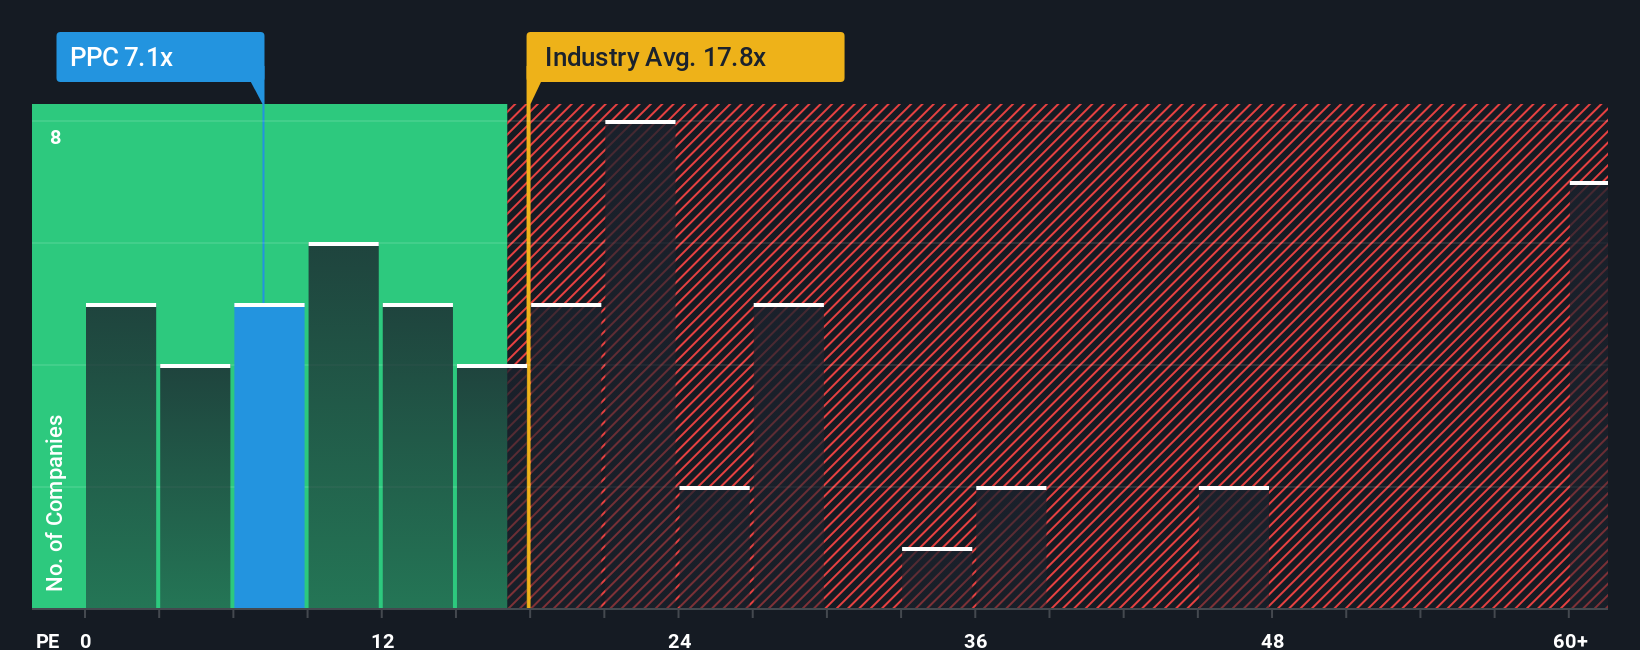
Approach 2: Pilgrim's Pride Price vs Earnings
For profitable companies like Pilgrim's Pride, the price to earnings, or PE, ratio is a straightforward way to gauge how much investors are willing to pay for each dollar of current earnings. In general, faster growing, more resilient businesses deserve higher PE multiples, while companies with slower growth or higher risk tend to trade on lower PE ratios.
Pilgrim's Pride currently trades on a PE of about 7.6x. That is well below the Food industry average of roughly 20.2x, and also below the peer group average of around 12.6x. On the surface this makes the stock look inexpensive compared to many competitors.
Simply Wall St takes this a step further with its Fair Ratio, an estimate of what Pilgrim's Pride PE should be once you factor in its earnings growth outlook, profitability, risk profile, industry and size. On this basis, the Fair Ratio for Pilgrim's Pride is 11.3x. Because this is meaningfully higher than the current 7.6x, the shares screen as undervalued on a PE basis, even after allowing for company specific risks.
Result: UNDERVALUED
PE ratios tell one story, but what if the real opportunity lies elsewhere? Discover 1466 companies where insiders are betting big on explosive growth.
Upgrade Your Decision Making: Choose your Pilgrim's Pride Narrative
Earlier we mentioned that there is an even better way to understand valuation, so let's introduce you to Narratives, a simple framework that lets you spell out the story you believe about Pilgrim's Pride, then tie that story to specific assumptions for future revenue, earnings, margins and an estimated fair value.
A Narrative on Simply Wall St links three things together in one place, the company story you believe, the financial forecast that story implies, and the fair value you get when you discount those cash flows and compare them to today’s share price.
Within the Simply Wall St Community page, Narratives are an easy, accessible tool used by millions of investors to track whether a stock looks like a buy, hold, or sell as fair value updates against the live market price.
Because Narratives update dynamically when fresh information arrives, like earnings releases, guidance changes or major news, they help you quickly see whether the story you believe still matches the numbers on the screen.
For Pilgrim's Pride, for example, one investor might anchor their Narrative around a fair value near the bearish $40 price target while another leans toward the more optimistic $57 view, and Narratives make those differing perspectives transparent and comparable.
Do you think there's more to the story for Pilgrim's Pride? Head over to our Community to see what others are saying!
This article by Simply Wall St is general in nature. We provide commentary based on historical data and analyst forecasts only using an unbiased methodology and our articles are not intended to be financial advice. It does not constitute a recommendation to buy or sell any stock, and does not take account of your objectives, or your financial situation. We aim to bring you long-term focused analysis driven by fundamental data. Note that our analysis may not factor in the latest price-sensitive company announcements or qualitative material. Simply Wall St has no position in any stocks mentioned.
Have feedback on this article? Concerned about the content? Get in touch with us directly. Alternatively, email editorial-team@simplywallst.com