
 Nasdaq
 华尔街日报
华尔街日报Has the Market Mispriced Woodside After Recent Share Price Slide Despite Strong DCF Signals?
- If you have been wondering whether Woodside Energy Group is a bargain or a potential value trap at today’s price, you are not alone. This article will walk through what the numbers are really saying.
- Despite a 7.8% slide over the last week and a 13.2% drop over the past month, the stock is still up 42.9% over five years. This tells us the long term story is very different from the recent red on the screen.
- Recent moves in the oil and gas complex, shifting expectations around global LNG demand, and ongoing debates about the pace of the energy transition have all been weighing on sentiment and volatility in names like Woodside. In addition, regulatory and geopolitical developments around key export markets have kept investors reassessing both risk and long term cash flow potential.
- Right now, Woodside scores a 5/6 valuation check rating, which suggests the market might be underestimating its value. However, the picture looks different depending on whether you use earnings, cash flows, or asset based lenses, and we will finish by looking at a smarter way to tie all those approaches together.
Find out why Woodside Energy Group's 3.5% return over the last year is lagging behind its peers.
Approach 1: Woodside Energy Group Discounted Cash Flow (DCF) Analysis
A Discounted Cash Flow, or DCF, model estimates what a company is worth by projecting its future cash flows and then discounting those back to today’s dollars. For Woodside Energy Group, the model used is a 2 Stage Free Cash Flow to Equity approach, built on cash flow projections rather than accounting earnings.
Woodside generated roughly $1.17 billion in free cash flow over the last twelve months, and analyst forecasts plus extrapolations suggest this could rise to about $8.82 billion by 2035. The projection path runs through intermediate years such as 2026 and 2029, with cash flows steadily stepping up as large LNG projects ramp and pricing assumptions normalize, though anything beyond the first five years relies on Simply Wall St’s growth estimates rather than direct analyst targets.
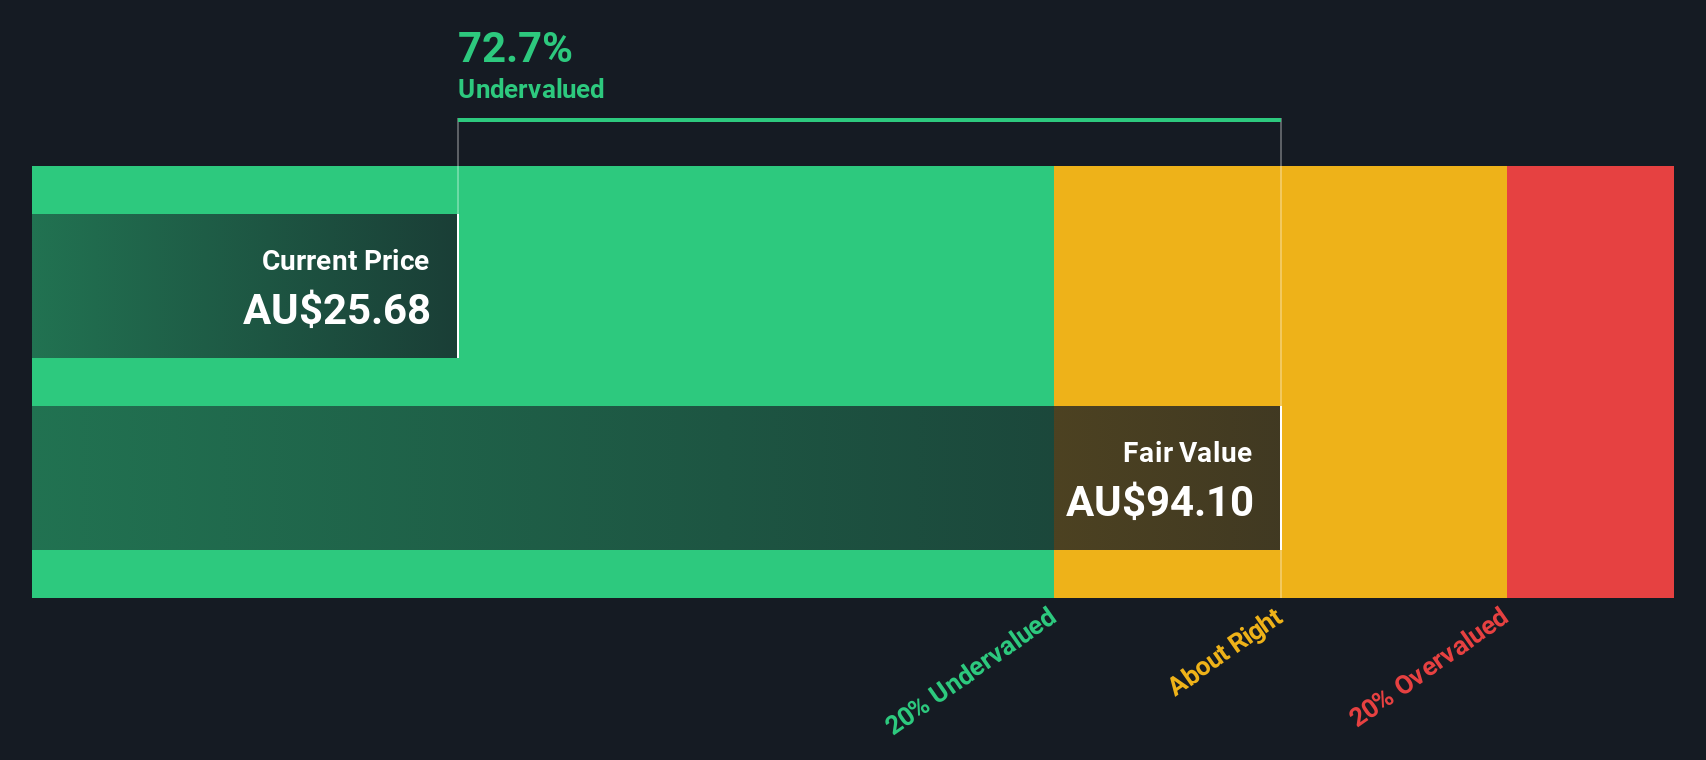
When all those projected cash flows are discounted back to today, the DCF model arrives at an intrinsic value of about $140.22 per share. Compared with the current market price, this points to an implied 83.7% discount, suggesting investors are pricing in much weaker cash generation or higher risk than the model assumes.
Result: UNDERVALUED
Our Discounted Cash Flow (DCF) analysis suggests Woodside Energy Group is undervalued by 83.7%. Track this in your watchlist or portfolio, or discover 918 more undervalued stocks based on cash flows.
Approach 2: Woodside Energy Group Price vs Earnings
For a profitable business like Woodside, the price to earnings (PE) ratio is a useful way to gauge whether investors are paying a reasonable price for each dollar of profit. In general, faster growth and lower perceived risk justify a higher PE multiple, while slower growth or higher risk should result in a lower, more conservative PE.
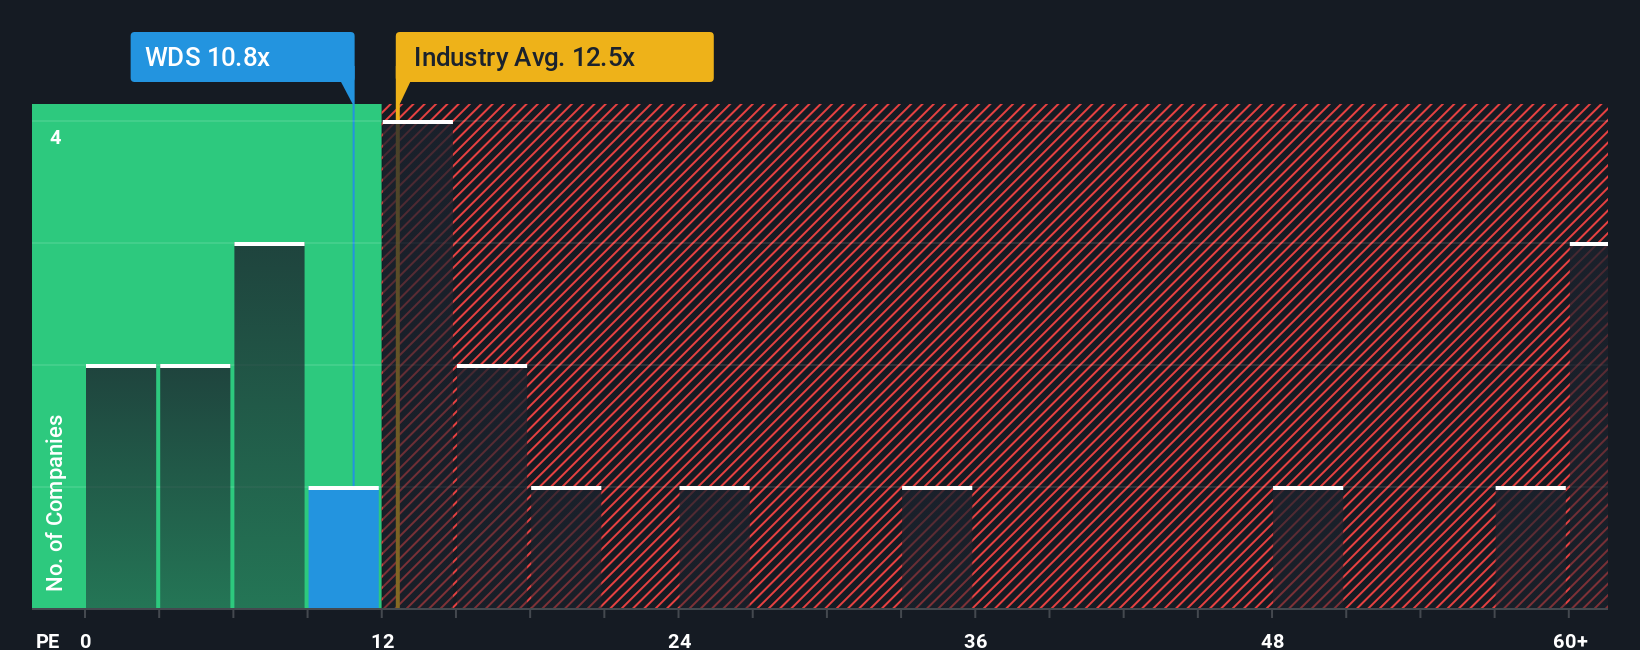
Woodside currently trades on a PE of about 9.7x, which sits below both the Oil and Gas industry average of roughly 13.1x and the broader peer group average of around 21.2x. At first glance, that discount suggests the market is cautious about the durability of its earnings or the risks around its project pipeline.
Simply Wall St’s Fair Ratio framework refines this view by estimating what PE multiple Woodside should trade on, given its earnings growth outlook, profitability, industry, market cap and specific risk profile. This proprietary Fair Ratio for Woodside is 13.2x, which is comfortably above the current 9.7x. Because it systematically adjusts for growth, risk and margins, the Fair Ratio is more informative than a simple comparison with peers or the sector. It points to Woodside looking undervalued on an earnings multiple basis.
Result: UNDERVALUED
PE ratios tell one story, but what if the real opportunity lies elsewhere? Discover 1460 companies where insiders are betting big on explosive growth.
Upgrade Your Decision Making: Choose your Woodside Energy Group Narrative
Earlier we mentioned that there is an even better way to understand valuation. Let us introduce you to Narratives, an easy tool on Simply Wall St’s Community page that lets you attach your own story about Woodside’s future revenue, earnings and margins to a financial forecast. You can then turn that into a Fair Value and compare it to the current price to help inform whether it may be attractive or unattractive, with those Narratives updating dynamically as new news or earnings arrive. For Woodside, you might see one investor building a bullish Narrative around long term LNG contracts, cost discipline and rate cuts that supports a Fair Value above the current A$27.42 analyst consensus. Another more cautious investor might lean on weaker growth assumptions, higher carbon and regulatory costs and project execution risks to arrive at a Fair Value closer to the most bearish A$22.76 target, both using the same company but different stories and numbers to guide their decisions.
Do you think there's more to the story for Woodside Energy Group? Head over to our Community to see what others are saying!

This article by Simply Wall St is general in nature. We provide commentary based on historical data and analyst forecasts only using an unbiased methodology and our articles are not intended to be financial advice. It does not constitute a recommendation to buy or sell any stock, and does not take account of your objectives, or your financial situation. We aim to bring you long-term focused analysis driven by fundamental data. Note that our analysis may not factor in the latest price-sensitive company announcements or qualitative material. Simply Wall St has no position in any stocks mentioned.
Have feedback on this article? Concerned about the content? Get in touch with us directly. Alternatively, email editorial-team@simplywallst.com