
 Nasdaq
 华尔街日报
华尔街日报Is It Too Late To Consider Tokyo Electron After Its Strong Multi Year Share Price Surge
- Wondering if Tokyo Electron is still worth buying after such a strong run, or if the easy money has already been made? This breakdown will walk you through what the current price is really implying.
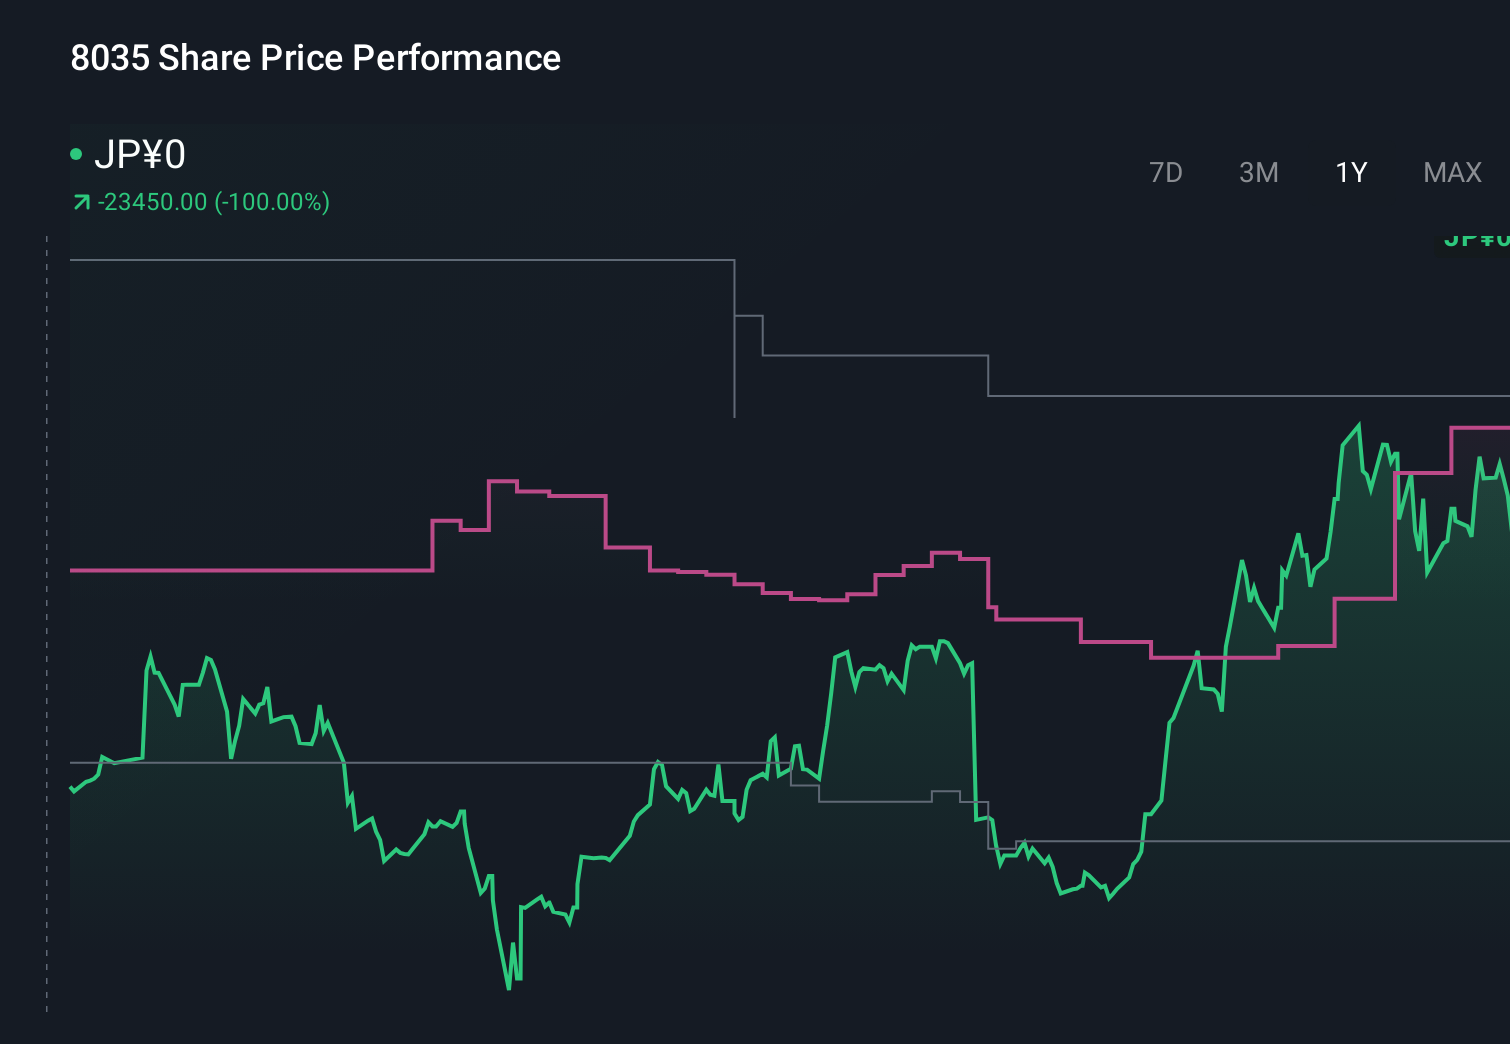
- The stock now trades around JP¥31,210, down 0.9% over the last week but still up 1.1% over 30 days, 28.1% year to date, and 37.3% over the last year, with gains of 155.3% and 190.9% over the past 3 and 5 years respectively. That naturally raises questions about how much upside is left versus the risk of a pullback.
- Those moves have been driven by growing optimism around semiconductor demand and capital equipment spending in areas like AI infrastructure and advanced logic production. At the same time, cyclical concerns around chip downturns and global capex budgets keep volatility elevated, making it even more important to separate long term value from short term noise.
- On our framework, Tokyo Electron currently scores 2/6 on undervaluation checks. This means some metrics point to value while others flash caution. Next we will dig into different valuation methods to see what they are really saying about the stock today, then finish with a more holistic way to think about valuation that numbers alone can miss.
Tokyo Electron scores just 2/6 on our valuation checks. See what other red flags we found in the full valuation breakdown.
Approach 1: Tokyo Electron Discounted Cash Flow (DCF) Analysis
A Discounted Cash Flow model estimates what a business is worth by projecting the cash it can generate in the future and then discounting those cash flows back to today in ¥ terms.
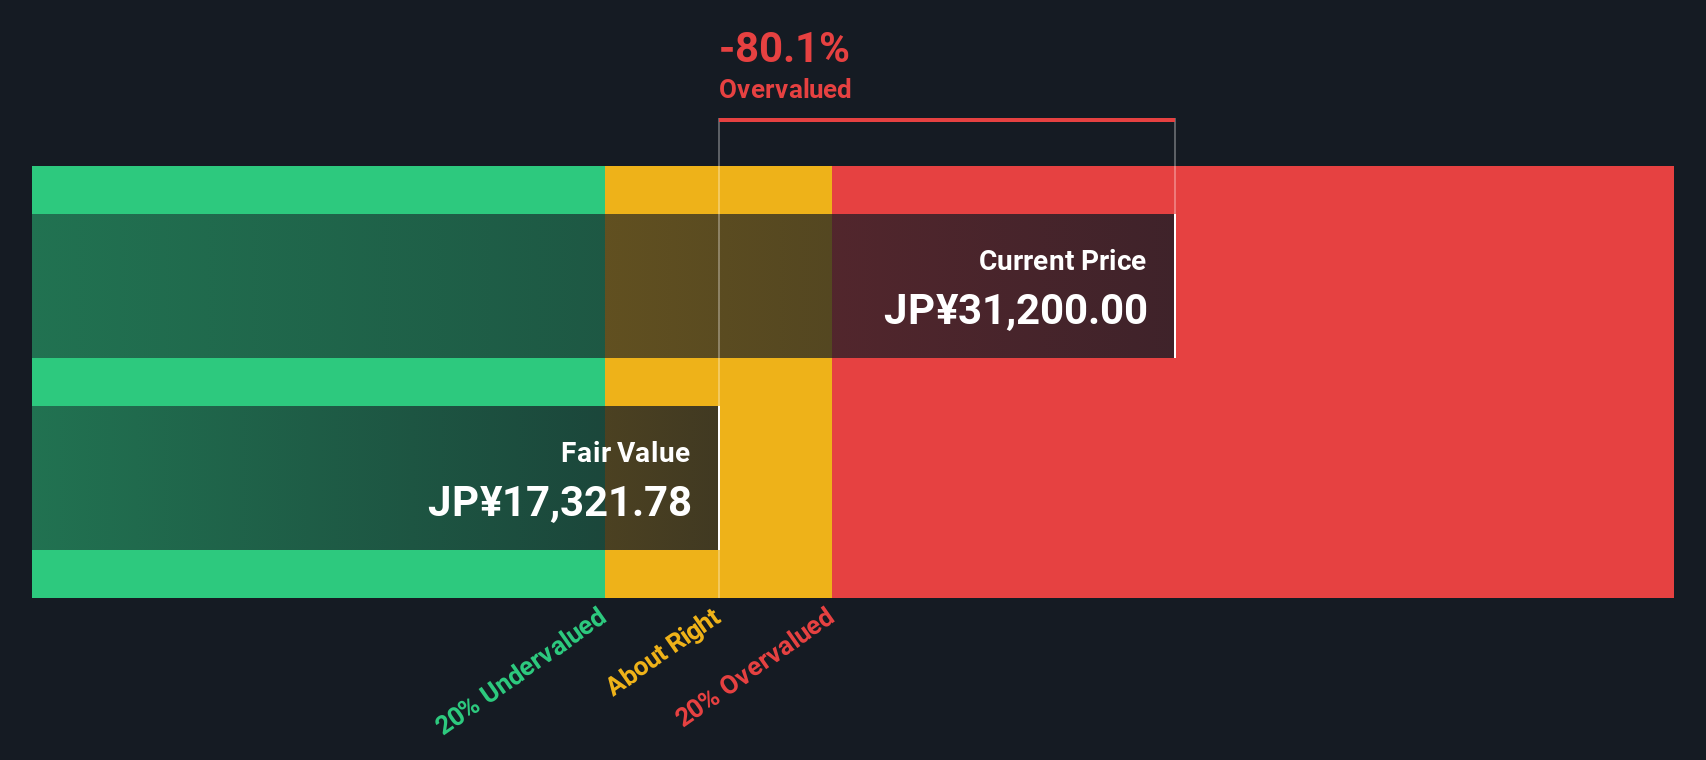
For Tokyo Electron, the latest twelve month free cash flow is about ¥319.2 billion. Analyst forecasts and subsequent extrapolations by Simply Wall St point to free cash flow rising to roughly ¥657.0 billion by 2030, based on a 2 Stage Free Cash Flow to Equity model. These projections suggest healthy growth in cash generation over the coming decade.
When all those future cash flows are discounted back, the intrinsic value comes out at around ¥17,352 per share. Compared with the current share price near ¥31,210, the DCF implies the stock is about 79.9% overvalued, suggesting expectations in the market are running far ahead of the model’s cash flow outlook.
Result: OVERVALUED
Our Discounted Cash Flow (DCF) analysis suggests Tokyo Electron may be overvalued by 79.9%. Discover 918 undervalued stocks or create your own screener to find better value opportunities.
Approach 2: Tokyo Electron Price vs Earnings
For profitable companies like Tokyo Electron, the price to earnings, or PE, ratio is a useful way to gauge how much investors are paying for each unit of current earnings. It ties the valuation directly to the bottom line that ultimately supports dividends, buybacks and reinvestment.
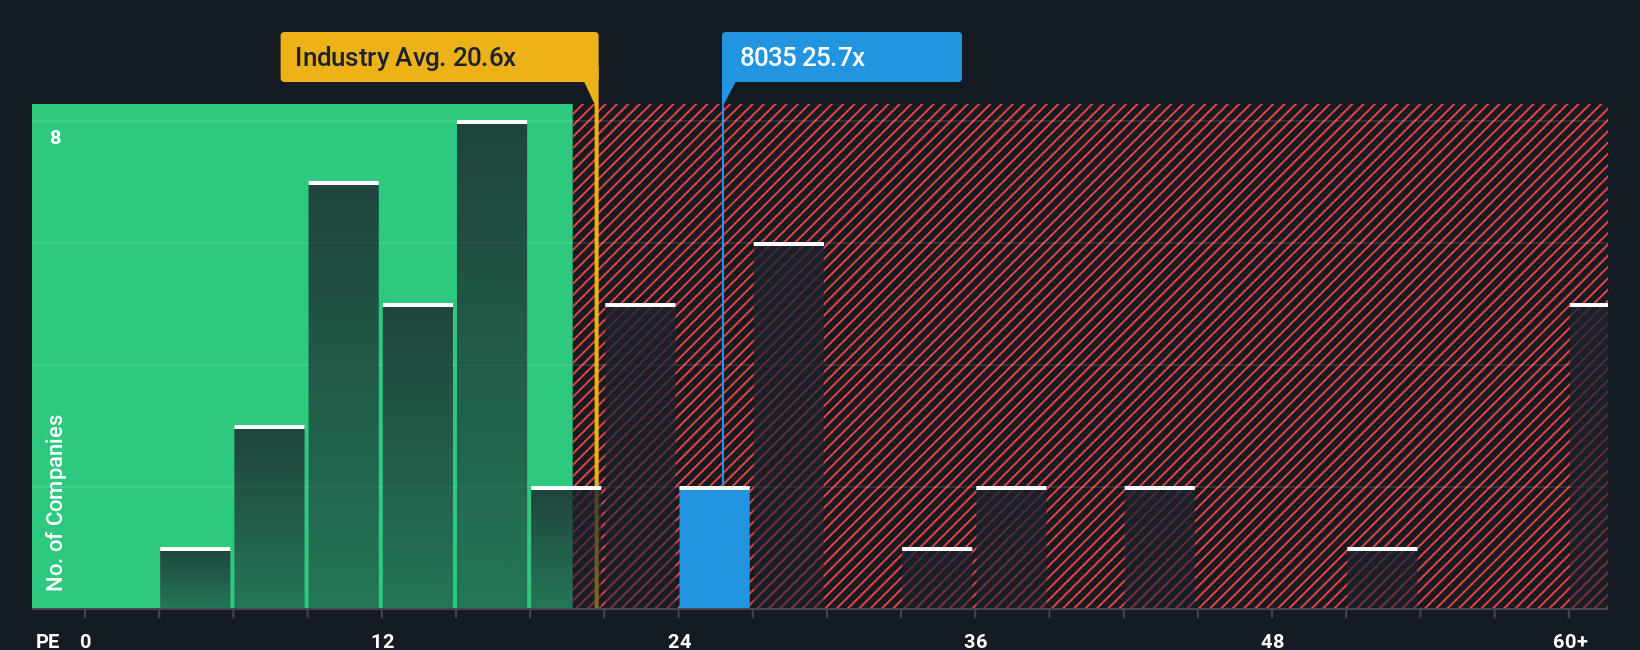
What counts as a fair PE depends on how fast earnings are expected to grow and how risky that growth looks. Higher growth and more predictable results can justify a higher multiple, while cyclical or uncertain earnings usually deserve a discount. Tokyo Electron currently trades on a PE of about 26.4x, which is above the wider semiconductor industry average of roughly 19.8x but below the peer group average near 37.6x.
Simply Wall St’s Fair Ratio metric estimates what a reasonable PE should be for this specific company, given its earnings growth profile, margins, industry, market cap and risk factors. Because it is tailored to Tokyo Electron rather than generic peers, it offers a more precise anchor than simple industry or peer comparisons. On this framework, Tokyo Electron’s Fair Ratio is around 27.3x, slightly above the current 26.4x, which suggests the shares are modestly undervalued rather than stretched.
Result: UNDERVALUED
PE ratios tell one story, but what if the real opportunity lies elsewhere? Discover 1460 companies where insiders are betting big on explosive growth.
Upgrade Your Decision Making: Choose your Tokyo Electron Narrative
Earlier we mentioned that there is an even better way to understand valuation, so let us introduce you to Narratives, a simple tool that lets you attach a clear story to the numbers by combining your view of Tokyo Electron’s future revenues, earnings and margins with a financial forecast and an explicit fair value estimate. A Narrative starts with your perspective on the business and then links that story to concrete assumptions in a forecast model. It then compares your resulting fair value to the current share price to help you assess whether Tokyo Electron looks like a buy, a hold, or a sell today. Narratives on Simply Wall St’s Community page, used by millions of investors, make this process accessible and dynamic because they automatically update as new earnings, news and guidance come in, so your thesis and fair value do not go stale. For example, some investors may build a bullish Tokyo Electron Narrative around accelerating AI driven equipment demand and a fair value near ¥34,725, while more cautious investors might focus on China exposure and cyclicality and land closer to ¥21,500. This clearly shows how different stories can lead to different decisions.
Do you think there's more to the story for Tokyo Electron? Head over to our Community to see what others are saying!
This article by Simply Wall St is general in nature. We provide commentary based on historical data and analyst forecasts only using an unbiased methodology and our articles are not intended to be financial advice. It does not constitute a recommendation to buy or sell any stock, and does not take account of your objectives, or your financial situation. We aim to bring you long-term focused analysis driven by fundamental data. Note that our analysis may not factor in the latest price-sensitive company announcements or qualitative material. Simply Wall St has no position in any stocks mentioned.
Have feedback on this article? Concerned about the content? Get in touch with us directly. Alternatively, email editorial-team@simplywallst.com