
 Nasdaq
 华尔街日报
华尔街日报Is It Time To Rethink Microchip Technology After Its Recent Share Price Surge?
- Wondering if Microchip Technology is actually a bargain or if the recent buzz is just noise? You are not alone, and this breakdown is designed to give you a clear, valuation first answer.
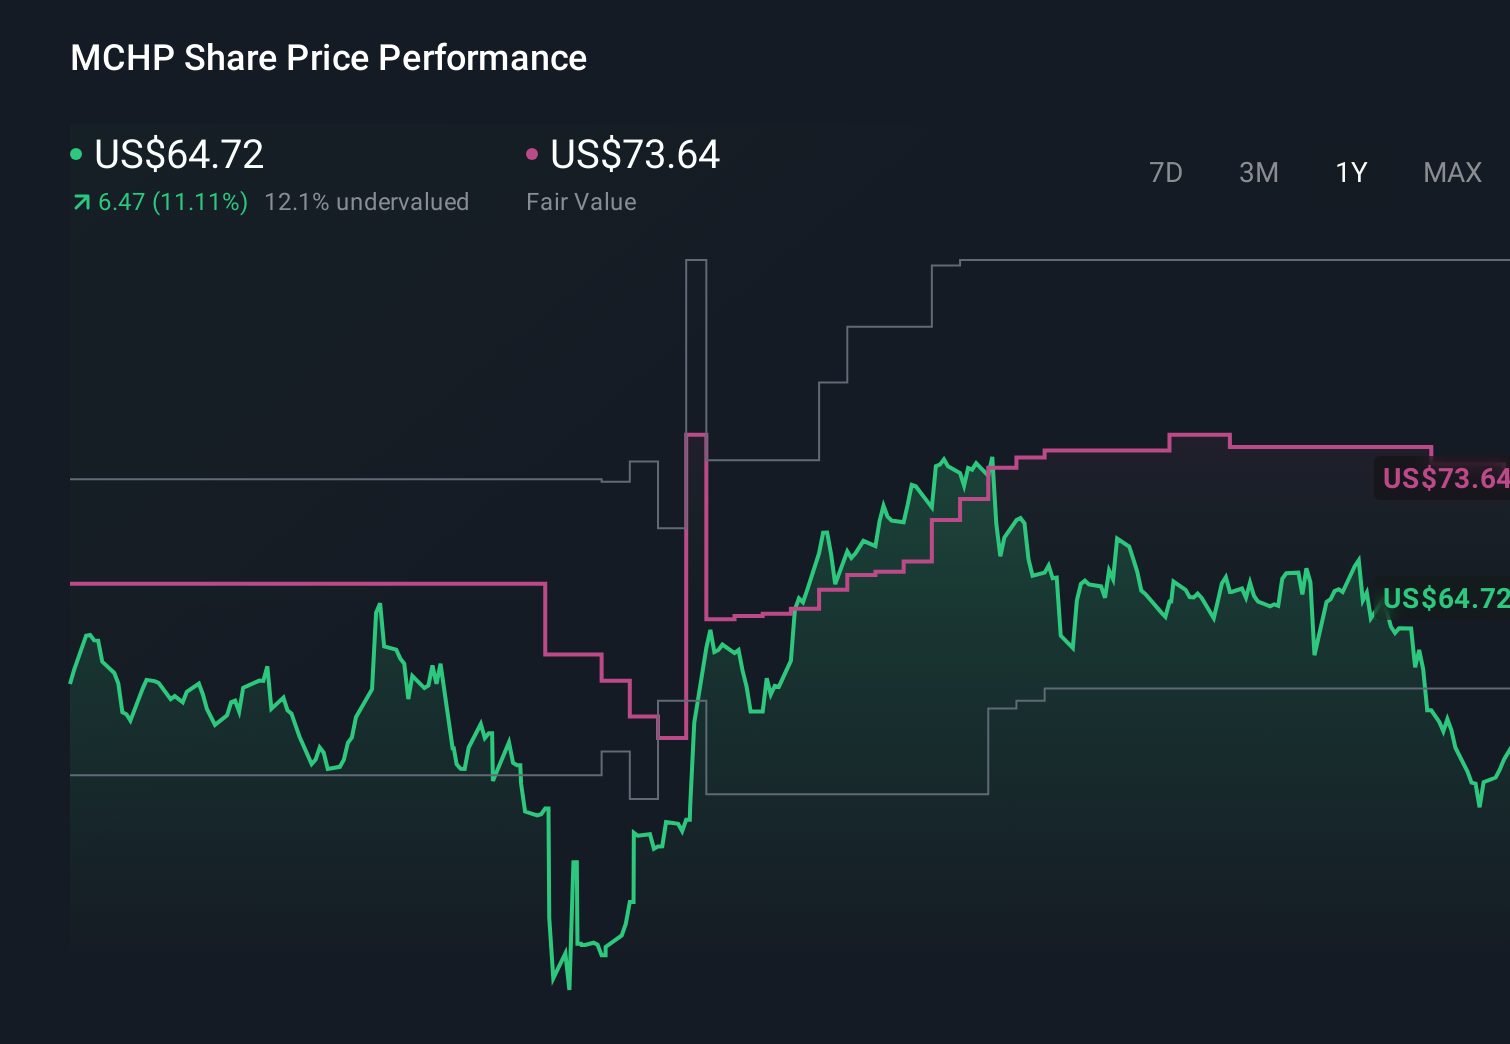
- The stock has been a bit of a rollercoaster lately, down 4.6% over the last week but still up 26.1% in the past month and 19.0% over the last year. That naturally raises the question of whether the current $64.06 price fairly reflects its long term potential.
- Recent headlines have focused on the broader semiconductor upcycle and ongoing expectations that chip demand will remain structurally higher as AI, automotive, and industrial applications scale out, putting companies like Microchip squarely in the spotlight. At the same time, renewed debate over cyclical risk in semis and shifting investor appetite for higher quality cash generative names have both influenced how the market is repricing the stock.
- Despite all that, Microchip currently scores just 0/6 on our valuation checks, suggesting the market may already be baking in a lot of optimism, or that the usual metrics are missing something important. Next we will walk through the main valuation approaches investors use for Microchip, then finish with a more holistic way to think about what the stock is really worth.
Microchip Technology scores just 0/6 on our valuation checks. See what other red flags we found in the full valuation breakdown.
Approach 1: Microchip Technology Discounted Cash Flow (DCF) Analysis
A Discounted Cash Flow model estimates what a company is worth by projecting the cash it can generate in the future and discounting those cash flows back to today in dollar terms.
For Microchip Technology, the latest twelve month Free Cash Flow is about $678.6 million. Analysts and internal estimates see this building steadily over time, with projected Free Cash Flow reaching roughly $2.6 billion by 2030, based on a 2 Stage Free Cash Flow to Equity approach that blends analyst forecasts for the next few years with more conservative, longer term growth assumptions thereafter.
When all those future cash flows are discounted back, the model arrives at an intrinsic value of about $56.78 per share. Compared with the current share price of $64.06, the DCF suggests the stock is around 12.8% overvalued, implying expectations embedded in the price are already quite optimistic.
Result: OVERVALUED
Our Discounted Cash Flow (DCF) analysis suggests Microchip Technology may be overvalued by 12.8%. Discover 918 undervalued stocks or create your own screener to find better value opportunities.

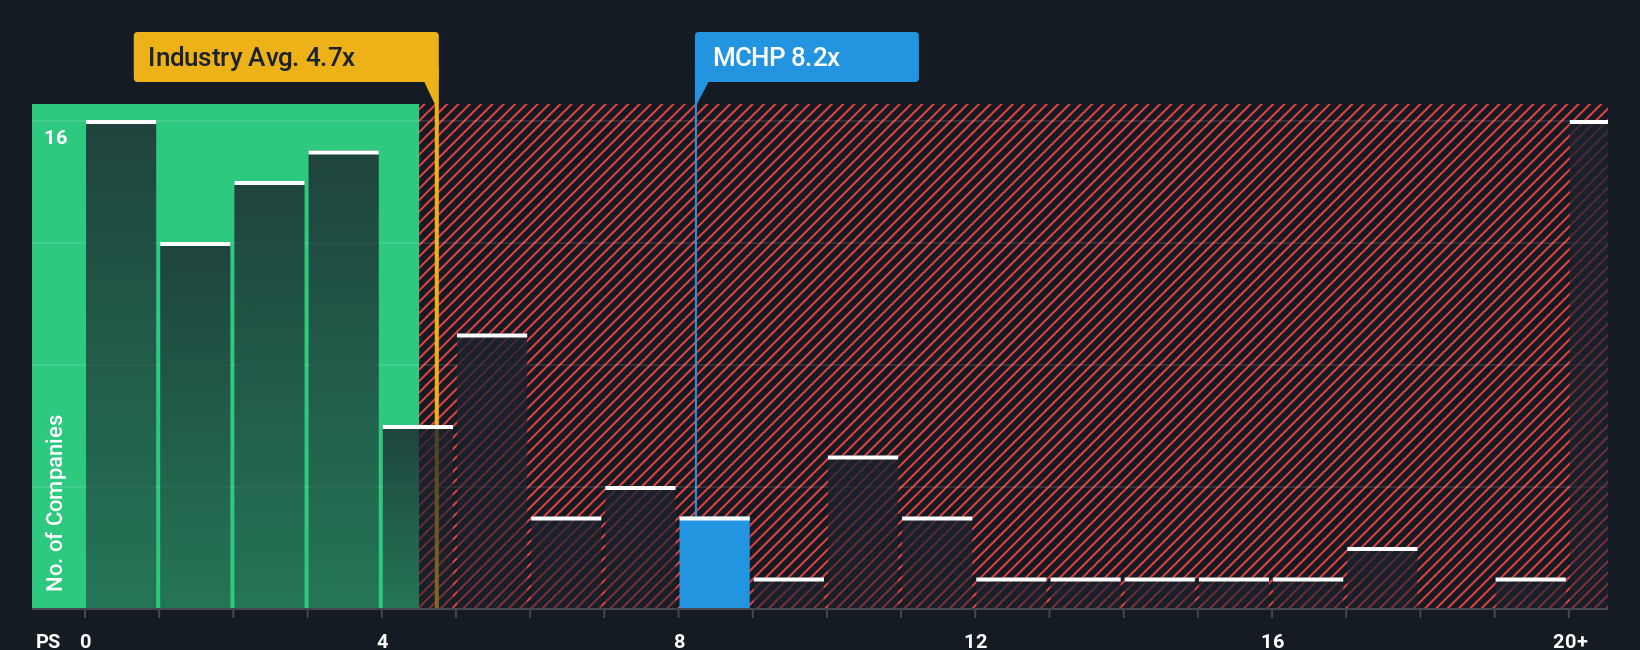
Approach 2: Microchip Technology Price vs Sales
For a profitable, established chip designer like Microchip, the Price to Sales (P/S) ratio is a useful way to compare how much investors are paying for each dollar of revenue, especially when earnings can be distorted by cycles, interest costs, or accounting items. In general, faster, more resilient growers with stronger margins and lower risk deserve a higher “normal” or “fair” sales multiple than slower, more volatile peers.
Microchip currently trades on a P/S of about 8.22x, which is higher than both the broader Semiconductor industry average of roughly 5.12x and the peer group average of around 6.97x. To go a step further, Simply Wall St estimates a proprietary “Fair Ratio” of 8.14x, which reflects what Microchip’s P/S should be given its growth outlook, profitability, industry position, size, and risk profile. This Fair Ratio is more informative than a simple peer or industry comparison because it adjusts for company specific factors rather than assuming all chip stocks deserve the same multiple.
With the actual P/S at 8.22x versus a Fair Ratio of 8.14x, Microchip looks slightly expensive on sales, but not by a wide margin.
Result: OVERVALUED
PS ratios tell one story, but what if the real opportunity lies elsewhere? Discover 1460 companies where insiders are betting big on explosive growth.
Upgrade Your Decision Making: Choose your Microchip Technology Narrative
Earlier we mentioned that there is an even better way to understand valuation. Let us introduce you to Narratives, an easy way to connect your story about Microchip Technology to a concrete forecast and fair value, all within Simply Wall St’s Community page used by millions of investors.
A Narrative is your structured perspective on a company, where you spell out what you think will happen to its revenue, earnings, and margins, and the platform turns that story into a financial forecast and an implied fair value per share.
Narratives can help you make decisions about your holdings by constantly comparing your fair value to the current share price. They update dynamically as new information such as earnings results, macro news, or tariff headlines becomes available.
For Microchip Technology, one investor might build a bullish Narrative that assumes demand recovery, 22 percent profit margins, and a fair value around 73.92 dollars, while another could take a more cautious view with slower growth, lower margins, and a fair value closer to 60 dollars. The platform makes those differences visible and trackable over time.
Do you think there's more to the story for Microchip Technology? Head over to our Community to see what others are saying!
This article by Simply Wall St is general in nature. We provide commentary based on historical data and analyst forecasts only using an unbiased methodology and our articles are not intended to be financial advice. It does not constitute a recommendation to buy or sell any stock, and does not take account of your objectives, or your financial situation. We aim to bring you long-term focused analysis driven by fundamental data. Note that our analysis may not factor in the latest price-sensitive company announcements or qualitative material. Simply Wall St has no position in any stocks mentioned.
Have feedback on this article? Concerned about the content? Get in touch with us directly. Alternatively, email editorial-team@simplywallst.com