
 Nasdaq
 华尔街日报
华尔街日报Has the Market Already Priced In OR Royalties Remarkable 2025 Rally?
- If you are wondering whether OR Royalties is still a smart buy after its big run, or if the easy money has already been made, you are not alone. Let us break down what the market might be pricing in.
- The stock has slipped about 1.2% over the last week, but is still up 5.3% over 30 days, 82.6% year to date and 88.8% over the past year. Gains of more than 200% over three years and nearly 229% over five years hint at a major re-rating of expectations.
- Behind those moves, investors have been reacting to a mix of sector tailwinds in precious metals and growing interest in royalty and streaming models, which can offer leveraged exposure to commodity prices without operating mine risk. At the same time, ongoing portfolio developments and deal flow have reinforced the narrative that OR Royalties can keep compounding its cash flows without taking on the same capital intensity as traditional miners.
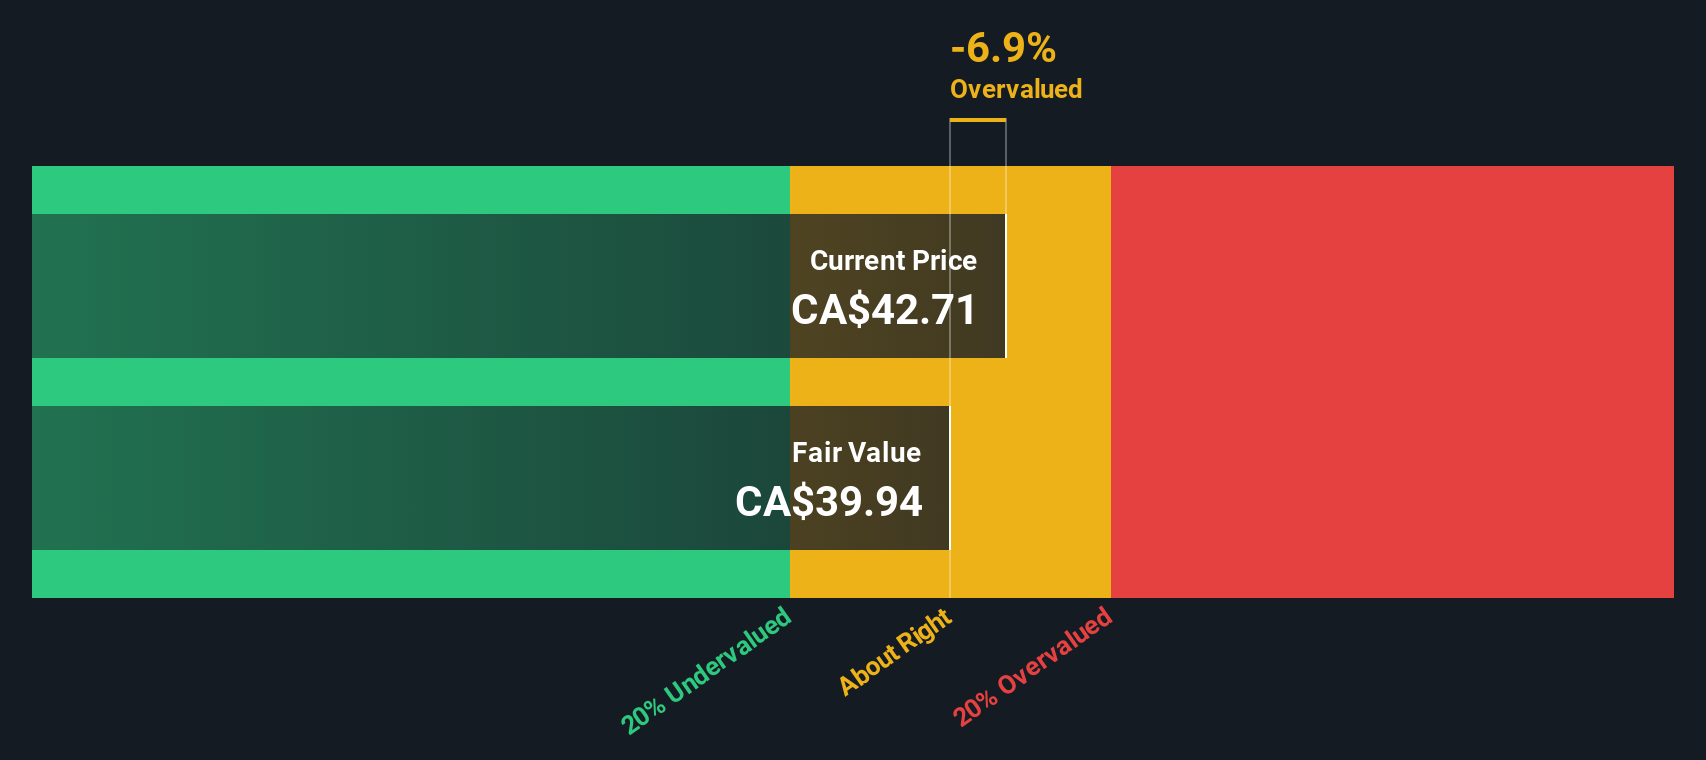
- On our checklist of six valuation tests, OR Royalties scores a 3 out of 6, which suggests the market may be partly but not fully recognizing its fundamentals. Next we will walk through different valuation approaches to see what that implies and to suggest a more nuanced way to think about fair value by the end of the article.
Find out why OR Royalties's 88.8% return over the last year is lagging behind its peers.
Approach 1: OR Royalties Discounted Cash Flow (DCF) Analysis
A Discounted Cash Flow model estimates what a business is worth today by projecting its future cash flows and discounting them back into present value. For OR Royalties, the model uses a 2 Stage Free Cash Flow to Equity framework built on cash flow projections.
The company generated about $53.2 Million in free cash flow over the last twelve months. Analyst forecasts, supplemented by Simply Wall St extrapolations beyond year five, point to free cash flow rising to roughly $491.8 Million by 2035, reflecting strong expected compounding as the royalty portfolio matures.
Aggregating and discounting these projected cash flows suggests an intrinsic value of about $61.95 per share. With the DCF implying the shares are trading at roughly a 20.9% discount to that value, the model indicates OR Royalties is meaningfully undervalued on a cash flow basis.
Result: UNDERVALUED
Our Discounted Cash Flow (DCF) analysis suggests OR Royalties is undervalued by 20.9%. Track this in your watchlist or portfolio, or discover 916 more undervalued stocks based on cash flows.
Approach 2: OR Royalties Price vs Earnings
For profitable businesses like OR Royalties, the price to earnings (PE) ratio is a useful way to see how much investors are paying for each dollar of current earnings. A higher PE can be justified if a company has stronger growth prospects or lower perceived risk, while slower growing or riskier firms typically deserve a lower, more conservative multiple.
OR Royalties currently trades on a PE of about 45.25x, which is more than double both the Metals and Mining industry average of roughly 20.88x and the peer average of around 23.03x. On the surface, that gap suggests the market is paying a substantial premium for its royalty model and growth outlook.
Simply Wall St also calculates a Fair Ratio of 20.63x, a proprietary estimate of what a reasonable PE should be once factors such as earnings growth, profitability, industry, market cap and risks are considered together. This Fair Ratio is more informative than a simple peer or industry comparison because it adjusts for OR Royalties’ specific profile. Since the current 45.25x multiple is well above the 20.63x Fair Ratio, the shares appear stretched on an earnings based view.
Result: OVERVALUED
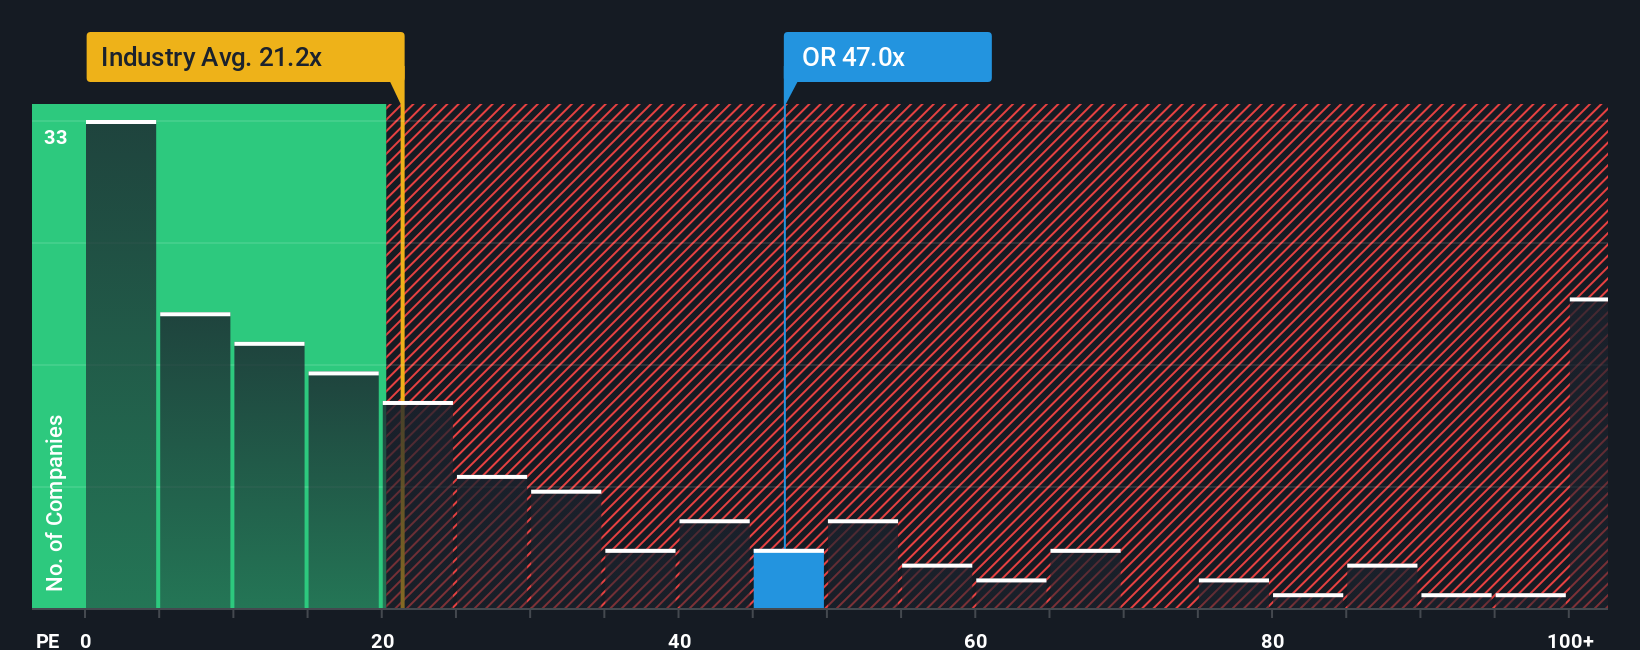
PE ratios tell one story, but what if the real opportunity lies elsewhere? Discover 1455 companies where insiders are betting big on explosive growth.
Upgrade Your Decision Making: Choose your OR Royalties Narrative
Earlier we mentioned that there is an even better way to understand valuation, so let us introduce you to Narratives, a simple way to connect the story you believe about OR Royalties to a set of numbers such as future revenue, earnings, margins and ultimately fair value. A Narrative is your structured perspective on the company, where you outline what you think will drive its business, translate that into a financial forecast, and then see what fair value those assumptions imply. On Simply Wall St, millions of investors build and share Narratives on the Community page, making this approach accessible even if you are not a valuation expert. Narratives then help you evaluate the stock by comparing your fair value to the current share price, and they update dynamically as new information like earnings or major news arrives. For example, one OR Royalties Narrative might assume robust double digit revenue growth and a premium multiple while another expects growth to slow and margins to compress, leading to very different fair values and perspectives.
Do you think there's more to the story for OR Royalties? Head over to our Community to see what others are saying!

This article by Simply Wall St is general in nature. We provide commentary based on historical data and analyst forecasts only using an unbiased methodology and our articles are not intended to be financial advice. It does not constitute a recommendation to buy or sell any stock, and does not take account of your objectives, or your financial situation. We aim to bring you long-term focused analysis driven by fundamental data. Note that our analysis may not factor in the latest price-sensitive company announcements or qualitative material. Simply Wall St has no position in any stocks mentioned.
Have feedback on this article? Concerned about the content? Get in touch with us directly. Alternatively, email editorial-team@simplywallst.com