
 Nasdaq
 华尔街日报
华尔街日报Does Salesforce’s Recent Pullback Offer an Opportunity Ahead of its AI Growth Ambitions?
- If you are wondering whether Salesforce is still worth buying at today’s price or if the best days are already priced in, you are not alone. This article is going to unpack exactly what you are paying for.
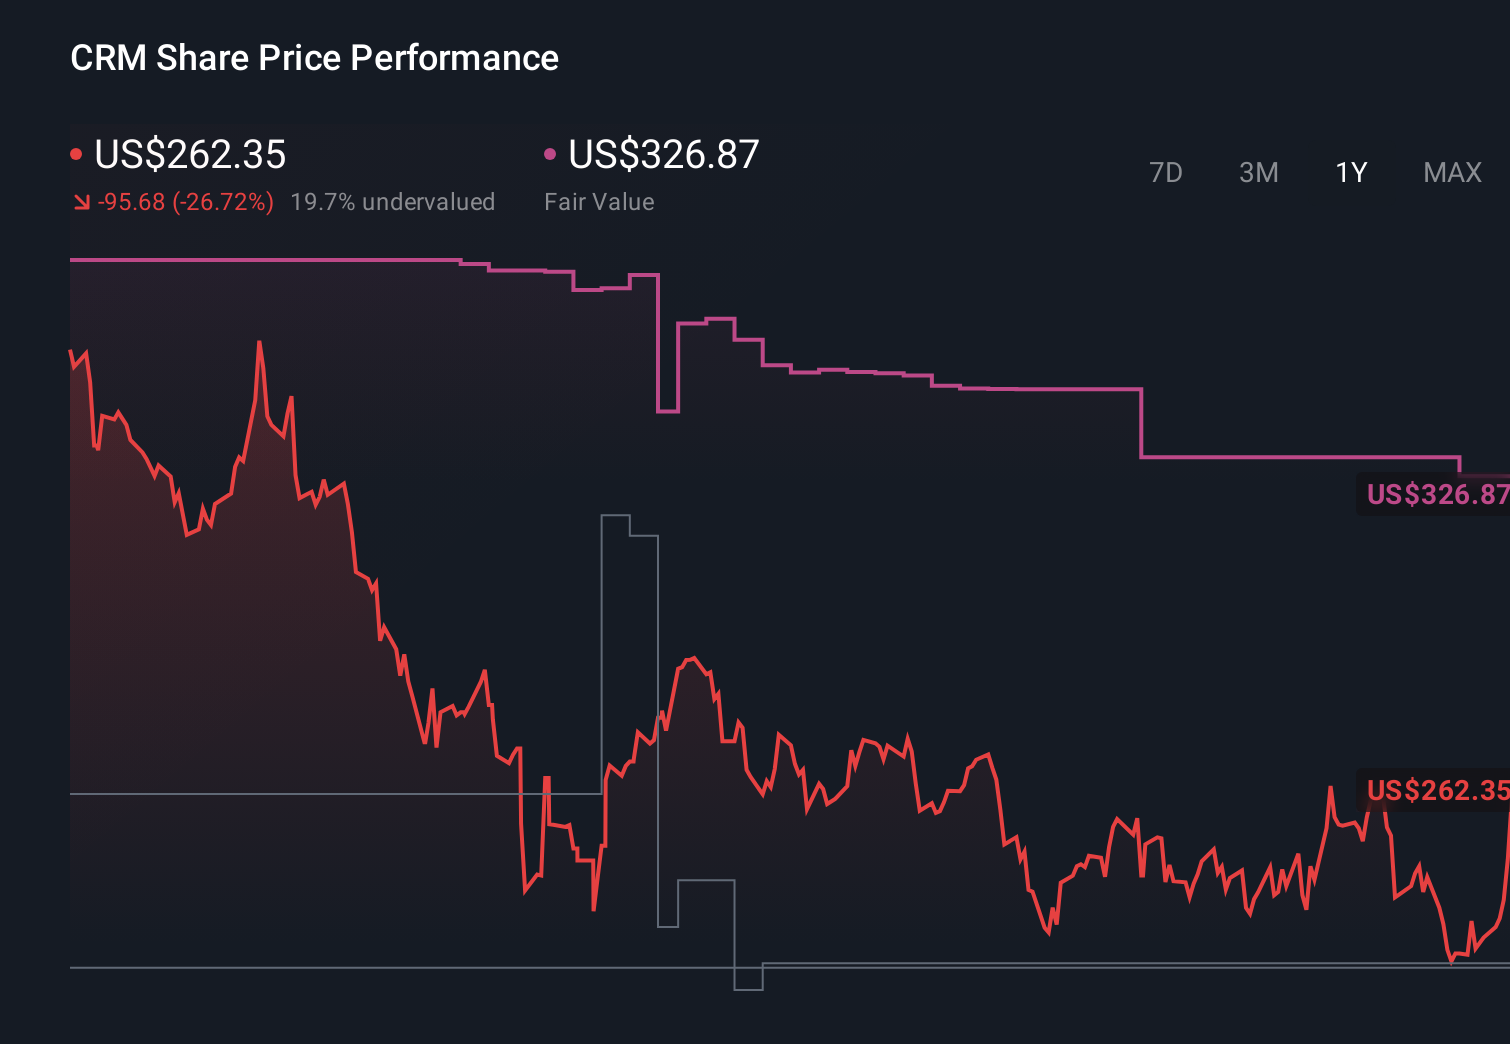
- After a choppy stretch where the stock is down about 1.8% over the last week and roughly 10.3% higher over the past month, Salesforce is still sitting on a steep drawdown of around 22.1% year to date and 22.9% over the last year, even though it has more than doubled, up about 101.9%, over the past 3 years.
- Those swings are set against a backdrop of Salesforce doubling down on its AI driven CRM strategy, high profile product launches and continued big ticket customer wins that reinforce its position at the center of many enterprises tech stacks. Together, these developments have investors debating whether the recent pullback is a reset after years of rapid growth or the start of a longer rerating.
- On our framework, Salesforce scores a 4/6 valuation check, which suggests it looks undervalued on several metrics but not across the board. Next we will walk through the main valuation approaches investors are using today and hint at a more holistic way of thinking about value that we will come back to at the end of the article.
Find out why Salesforce's -22.9% return over the last year is lagging behind its peers.
Approach 1: Salesforce Discounted Cash Flow (DCF) Analysis
A Discounted Cash Flow model estimates what Salesforce is worth today by projecting its future cash flows and then discounting those back into today’s dollars. In this case, the model uses a 2 stage Free Cash Flow to Equity framework.
Salesforce generated about $12.8 billion in free cash flow over the last twelve months, and analyst forecasts, combined with Simply Wall St extrapolations, see this rising steadily to roughly $27.1 billion by 2035. The projections step up through the late 2020s, with discounted free cash flows in the $12.9 billion to $13.6 billion range each year, before growth moderates in the 2030s.
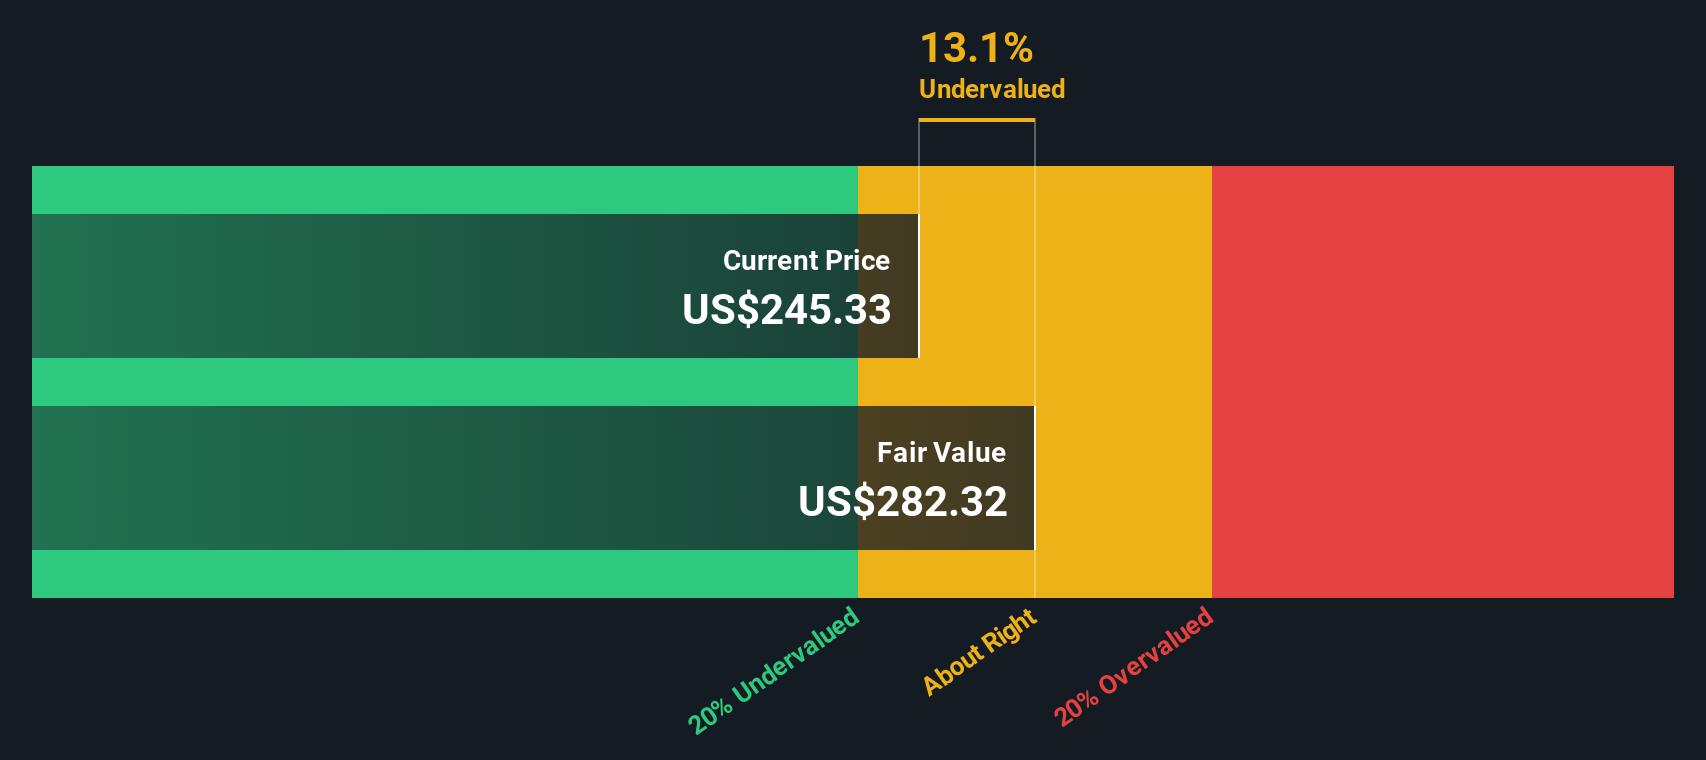
When all those future cash flows are added up and discounted, the model arrives at an intrinsic value of about $385.29 per share. Compared with the current share price, this output indicates Salesforce is trading at roughly a 33.1% discount to its estimated fair value, which the model interprets as the market not fully pricing in its long term cash generation potential.
Result: UNDERVALUED (Model Output)
Our Discounted Cash Flow (DCF) analysis suggests Salesforce is undervalued by 33.1%. Track this in your watchlist or portfolio, or discover 916 more undervalued stocks based on cash flows.
Approach 2: Salesforce Price vs Earnings
For a profitable, mature software leader like Salesforce, the price to earnings ratio is a useful shorthand for how much investors are willing to pay for each dollar of current earnings. It naturally reflects both what the business is earning today and how the market feels about its future.
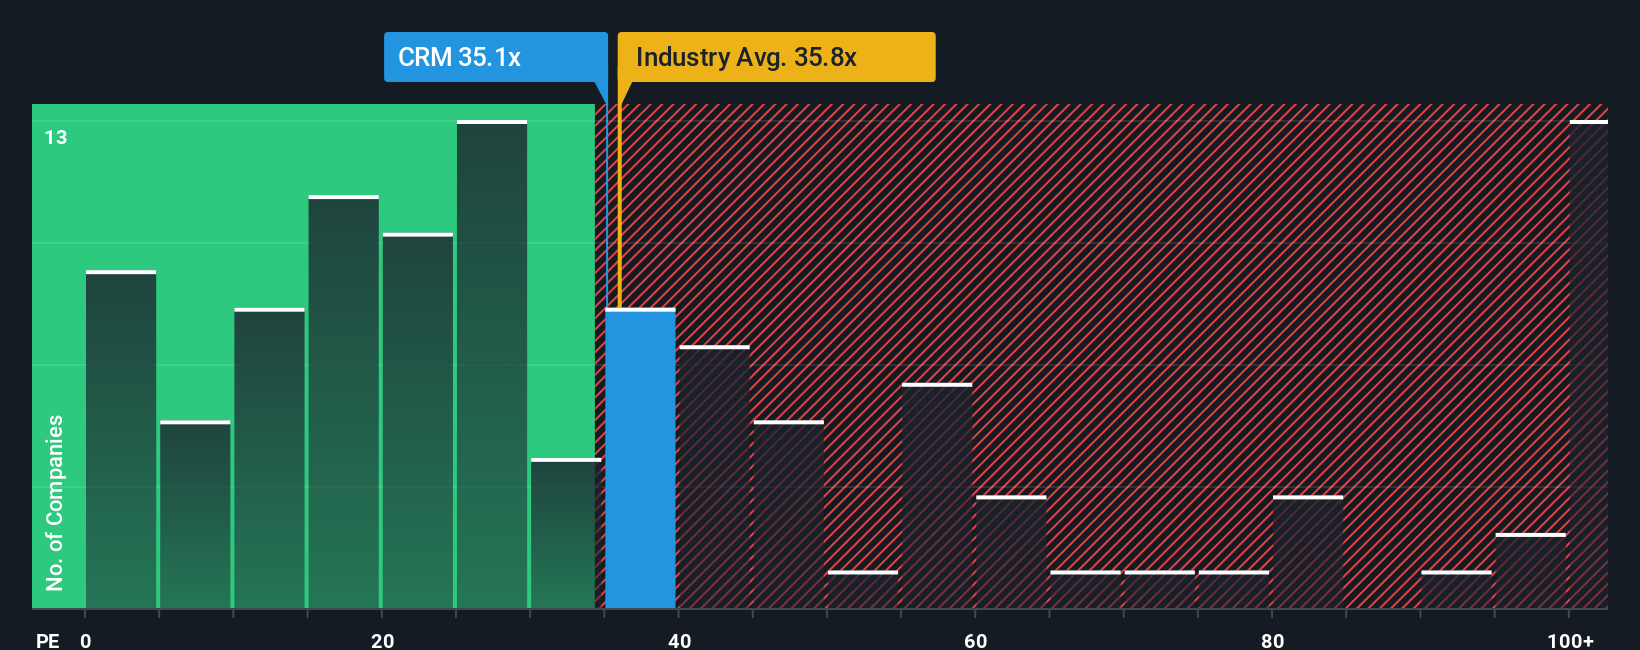
In practice, faster growing, higher margin and lower risk companies usually deserve a higher, or premium, PE multiple, while slower or riskier names tend to trade on a discount. Salesforce currently trades on about 33.4x earnings, which is slightly above the broader Software industry average of roughly 31.5x, but well below the 55.8x average of its higher flying peers. That comparison might suggest the stock is somewhere between fairly valued and modestly cheap.
Simply Wall St’s proprietary Fair Ratio for Salesforce is 40.7x, which estimates the multiple the company should trade on after accounting for its earnings growth outlook, profitability, risk profile, industry positioning and market cap. This is more tailored than a simple comparison with peers or the industry, because it adjusts for the fact that not all software companies grow or execute at the same pace. With the actual PE of 33.4x sitting notably below the 40.7x Fair Ratio, the multiple based view points to the shares being undervalued.
Result: UNDERVALUED
PE ratios tell one story, but what if the real opportunity lies elsewhere? Discover 1455 companies where insiders are betting big on explosive growth.
Upgrade Your Decision Making: Choose your Salesforce Narrative
Earlier we mentioned that there is an even better way to understand valuation, so let us introduce you to Narratives, an easy way to connect the story you believe about Salesforce with the numbers behind it. A Narrative on Simply Wall St lets you spell out your view of Salesforce’s future revenue, earnings and margins, turn that into a forecast, and then into a Fair Value that you can compare directly with today’s share price to decide whether it looks like a buy, hold or sell. These Narratives live inside the Community page on the platform used by millions of investors, and they update dynamically as new information, like earnings results or major AI announcements, comes in, so your Fair Value does not go stale. For example, one Salesforce Narrative might assume slower growth, lower margins and a Fair Value closer to $220, while a more optimistic Narrative could bake in stronger AI adoption and efficiency, arriving at a Fair Value nearer $430. That spread in views shows how different stories about the same company can lead to very different investable conclusions.
Do you think there's more to the story for Salesforce? Head over to our Community to see what others are saying!
This article by Simply Wall St is general in nature. We provide commentary based on historical data and analyst forecasts only using an unbiased methodology and our articles are not intended to be financial advice. It does not constitute a recommendation to buy or sell any stock, and does not take account of your objectives, or your financial situation. We aim to bring you long-term focused analysis driven by fundamental data. Note that our analysis may not factor in the latest price-sensitive company announcements or qualitative material. Simply Wall St has no position in any stocks mentioned.
Have feedback on this article? Concerned about the content? Get in touch with us directly. Alternatively, email editorial-team@simplywallst.com