
 Nasdaq
 华尔街日报
华尔街日报Does Equifax’s Recent Slide Make Its 2025 Valuation Look Attractive or Stretched?
- Wondering if Equifax at around $219 a share is a bargain, fairly priced, or something to avoid right now? You are not alone, and that is exactly what we are going to unpack.
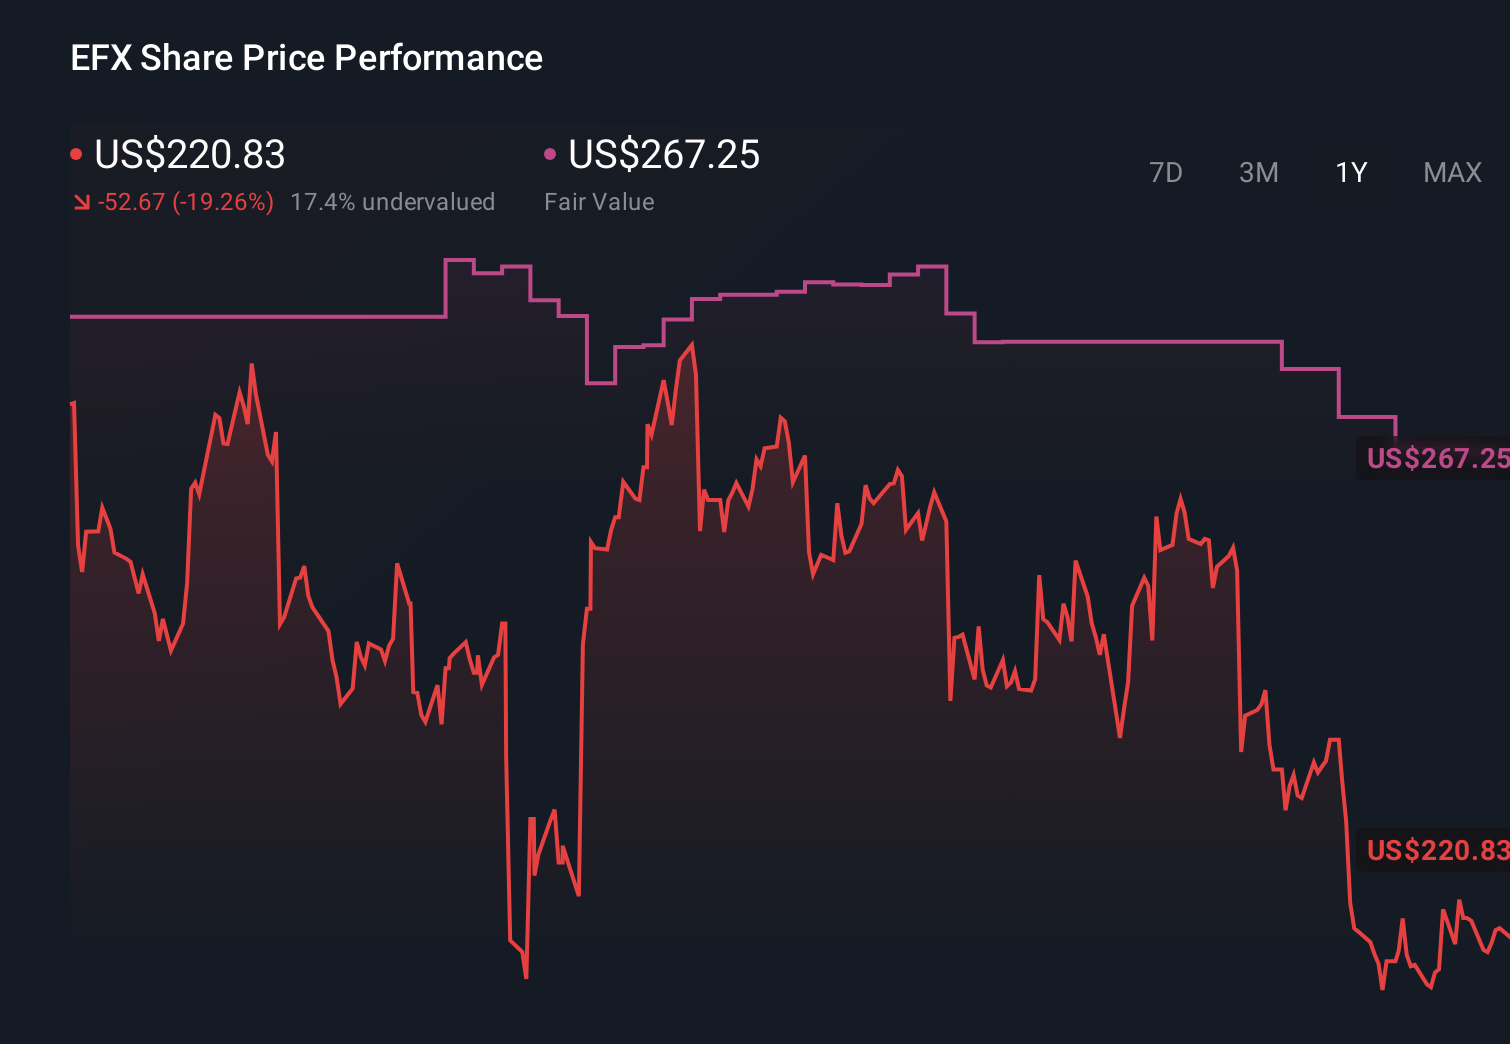
- Despite being down about 12.6% year to date and 12.8% over the last year, the stock has shown some resilience lately, slipping only 0.5% in the last week but climbing 7.3% over the past month.
- Those moves are happening against a backdrop of ongoing scrutiny and investment in credit reporting, digital identity, and fraud prevention. These are areas where Equifax is working to expand its data and analytics footprint. Investors are also weighing how regulatory developments, data security expectations, and demand for consumer credit information might shape the company’s long term growth profile.
- On our valuation framework Equifax scores a 3/6, suggesting it screens as undervalued on only half of our checks. Next we will break down what different valuation methods say about the stock, and finish by looking at a more holistic way to judge whether the current price really makes sense.
Find out why Equifax's -12.8% return over the last year is lagging behind its peers.
Approach 1: Equifax Discounted Cash Flow (DCF) Analysis
A Discounted Cash Flow model estimates what a business is worth today by projecting the cash it could generate in the future and then discounting those cash flows back to their value in today’s dollars.
For Equifax, the starting point is last twelve month free cash flow of about $892 million. Analysts provide explicit forecasts for the next few years, and from there Simply Wall St extrapolates a second stage of longer term growth. Under this 2 stage Free Cash Flow to Equity model, Equifax’s free cash flow is projected to grow to a little over $4.1 billion by 2035, reflecting expansion in its data and analytics driven business.
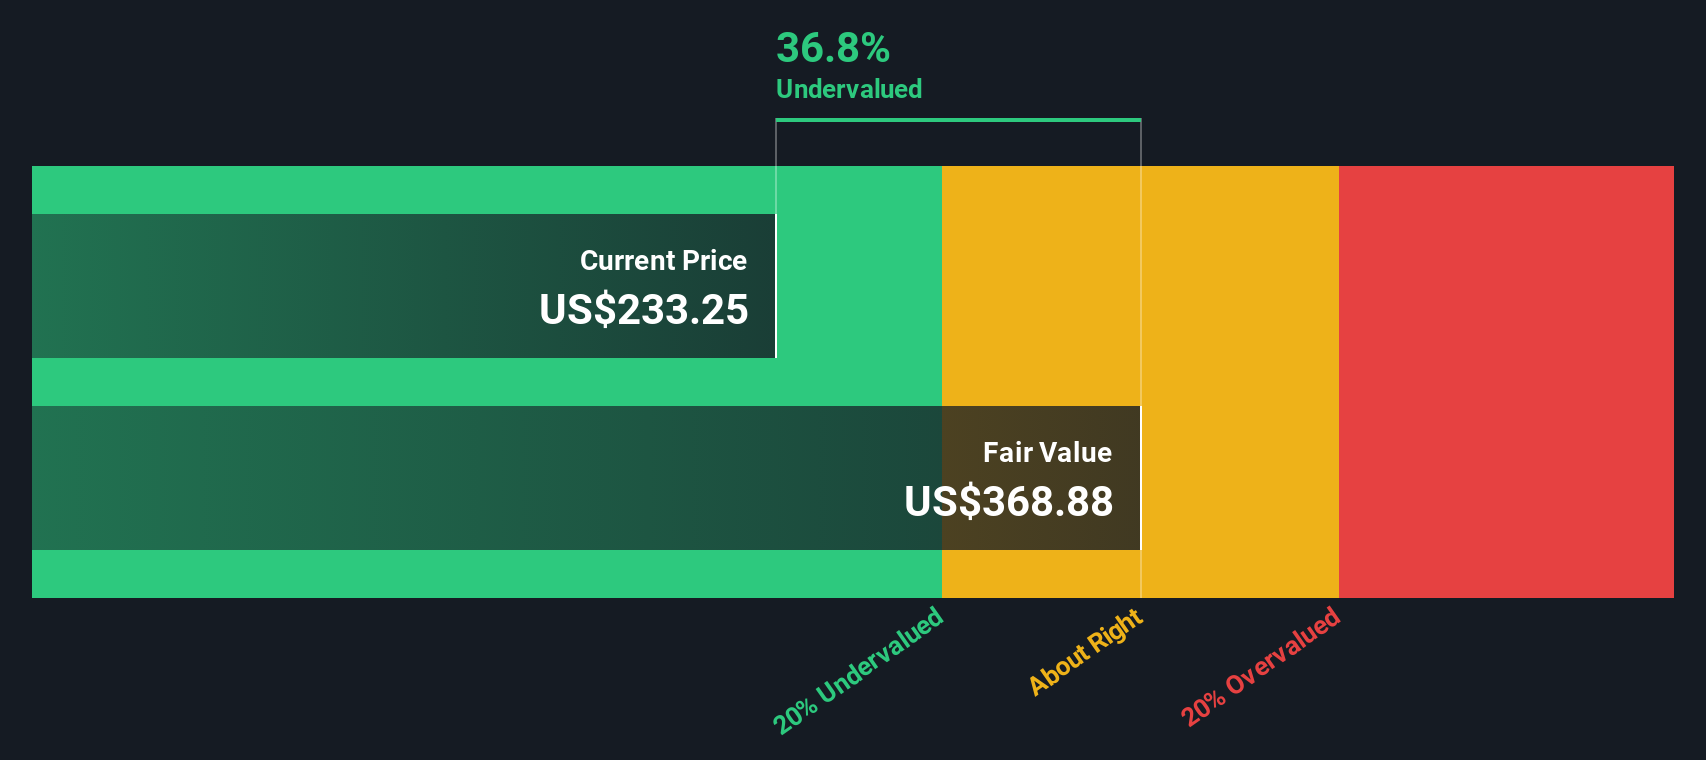
When all those future $ cash flows are discounted back, the model arrives at an estimated intrinsic value of roughly $544.73 per share. Compared with the current share price around $219, the DCF implies the stock is trading at about a 59.7% discount to its estimated fair value.
Result: UNDERVALUED
Our Discounted Cash Flow (DCF) analysis suggests Equifax is undervalued by 59.7%. Track this in your watchlist or portfolio, or discover 916 more undervalued stocks based on cash flows.
Approach 2: Equifax Price vs Earnings
For a consistently profitable business like Equifax, the price to earnings (PE) ratio is a useful way to gauge how much investors are willing to pay for each dollar of current earnings. In general, companies with stronger, more reliable growth prospects and lower perceived risk can justify higher PE multiples, while slower growing or riskier businesses tend to trade on lower PE ratios.
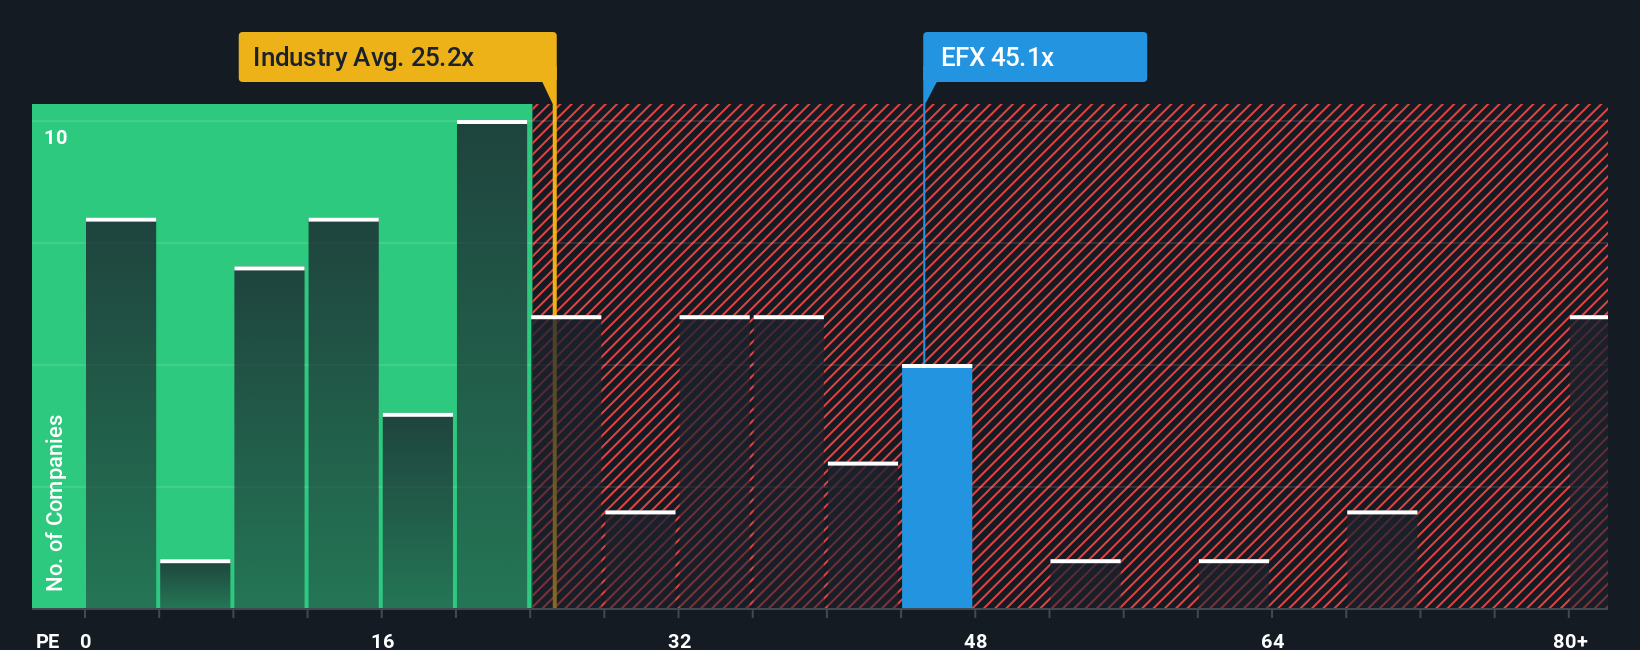
Equifax currently trades on a PE of about 40.8x, which is notably higher than both the Professional Services industry average of roughly 24.5x and the peer group average around 34.8x. To move beyond simple comparisons, Simply Wall St estimates a proprietary Fair Ratio of 33.6x. This reflects what would be a reasonable PE for Equifax once you factor in its earnings growth outlook, profitability, risk profile, industry, and market cap. This Fair Ratio framework is more informative than a straight peer or industry comparison because it adjusts for those company specific characteristics instead of assuming all businesses deserve similar multiples. With Equifax’s current PE sitting well above the 33.6x Fair Ratio, the stock screens as expensive on this metric.
Result: OVERVALUED
PE ratios tell one story, but what if the real opportunity lies elsewhere? Discover 1455 companies where insiders are betting big on explosive growth.
Upgrade Your Decision Making: Choose your Equifax Narrative
Earlier we mentioned that there is an even better way to understand valuation, so let us introduce you to Narratives, a simple way to turn your view of Equifax’s business into a structured story that connects assumptions about future revenue, earnings, and margins to a clear fair value estimate.
On Simply Wall St, Narratives live in the Community page and are used by millions of investors as an easy tool to link a company’s qualitative story, for example Equifax’s data moat, regulatory risks, or mortgage headwinds, directly to a financial forecast, then to a fair value that can be compared with today’s share price to decide whether to buy, hold, or sell.
Because Narratives are dynamic, they update automatically as new information such as earnings results, product launches, or regulatory news comes in. This means your estimated fair value moves with the story rather than staying frozen in time.
For example, one Equifax Narrative might lean bullish with a fair value near $300 because it assumes faster growth and resilient margins. A more cautious Narrative could land closer to $240 by baking in tougher competition, showing how different perspectives on the same company lead to different, but clearly explainable, fair values.
Do you think there's more to the story for Equifax? Head over to our Community to see what others are saying!
This article by Simply Wall St is general in nature. We provide commentary based on historical data and analyst forecasts only using an unbiased methodology and our articles are not intended to be financial advice. It does not constitute a recommendation to buy or sell any stock, and does not take account of your objectives, or your financial situation. We aim to bring you long-term focused analysis driven by fundamental data. Note that our analysis may not factor in the latest price-sensitive company announcements or qualitative material. Simply Wall St has no position in any stocks mentioned.
Have feedback on this article? Concerned about the content? Get in touch with us directly. Alternatively, email editorial-team@simplywallst.com