
 Nasdaq
 华尔街日报
华尔街日报Is PSEG Fairly Priced After Recent Grid Investment Momentum and Mixed Valuation Signals?
- Wondering if Public Service Enterprise Group is quietly trading at a bargain or already priced for perfection? You are not alone, and that is exactly what we are going to unpack here.
- The stock is sitting around $80.65, up 2.1% over the last week but still down 2.1% over 30 days and 5.2% year to date, while longer term holders are looking at gains of 48.4% over 3 years and 66.9% over 5 years.
- Recent moves have been shaped by a steady drumbeat of policy, regulatory, and grid investment headlines that keep utilities like PSEG in the spotlight, especially as investors weigh the role of regulated cash flows in a higher rate world. In addition, ongoing discussion about US infrastructure upgrades and the energy transition has sharpened focus on companies that can both modernize the grid and support reliability.
- Even so, PSEG only scores a 1 out of 6 on our valuation checks. This raises the question of whether traditional measures are telling the full story, so next we will walk through the main valuation methods, then finish with a more nuanced way to think about what this stock is really worth.
Public Service Enterprise Group scores just 1/6 on our valuation checks. See what other red flags we found in the full valuation breakdown.
Approach 1: Public Service Enterprise Group Dividend Discount Model (DDM) Analysis
The Dividend Discount Model estimates what a stock is worth by projecting all future dividends a company is expected to pay and discounting them back to today, essentially asking what those cash payouts are worth in present value terms.
For Public Service Enterprise Group, the model uses a recent dividend per share of about $2.79, a return on equity of roughly 12.2%, and a payout ratio near 62%. Based on these inputs, long run dividend growth is capped at 3.26%, even though the company has historically been able to grow a bit faster, with an expected growth rate of about 4.6%. This conservative growth cap is intended to avoid overstating value for a mature regulated utility.
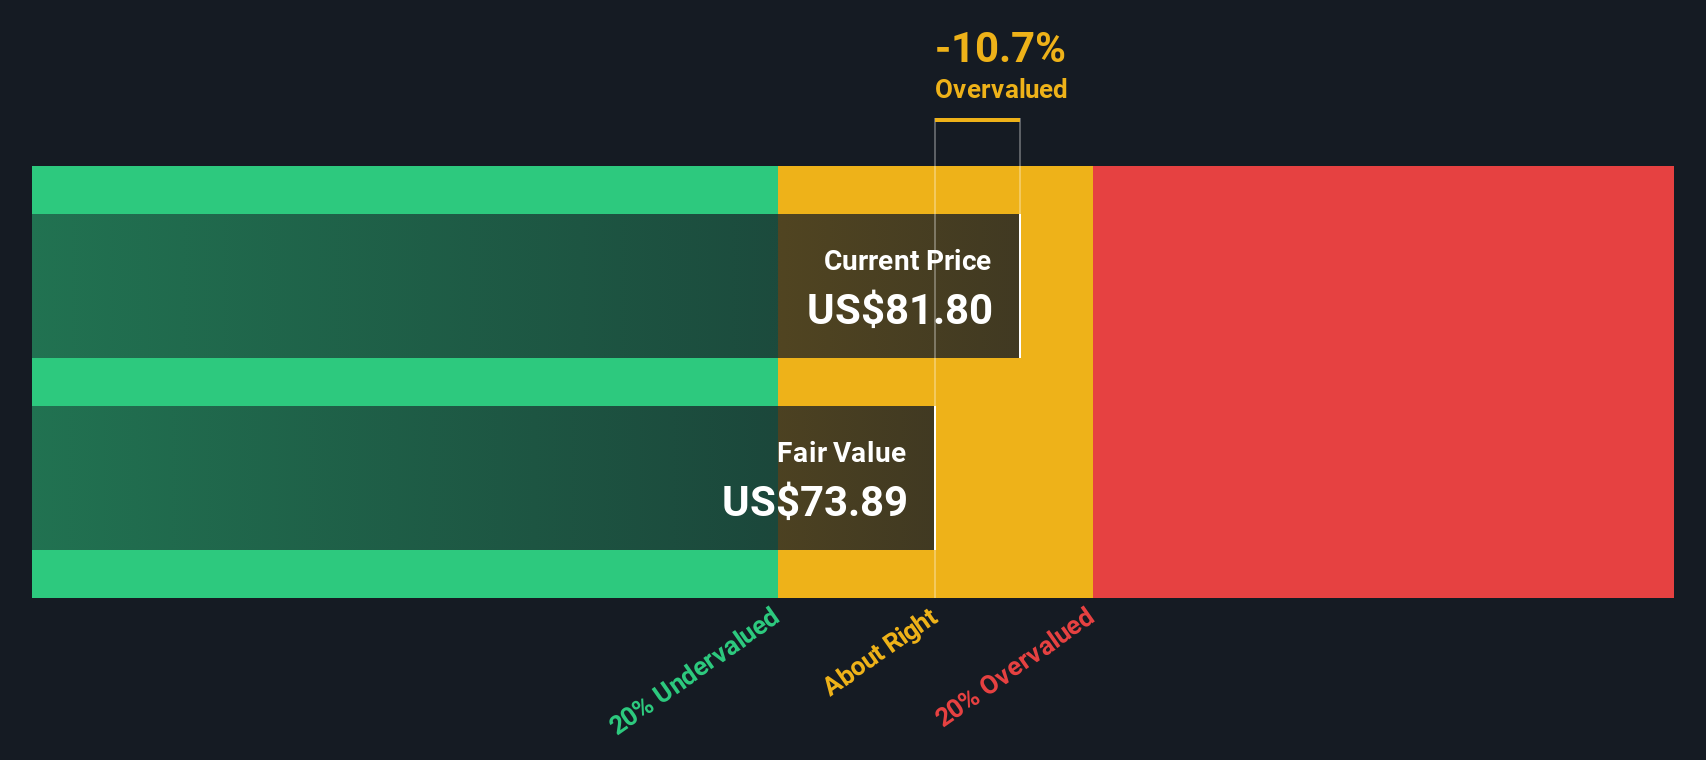
Combining these assumptions, the DDM arrives at an intrinsic value of roughly $75.40 per share. With the stock trading around $80.65, that implies it is about 7.0% above the model’s estimate of fair value, which points to mild overvaluation rather than a glaring mispricing.
Result: ABOUT RIGHT
Public Service Enterprise Group is fairly valued according to our Dividend Discount Model (DDM), but this can change at a moment's notice. Track the value in your watchlist or portfolio and be alerted on when to act.
Approach 2: Public Service Enterprise Group Price vs Earnings
For a profitable, relatively mature utility like Public Service Enterprise Group, the price to earnings ratio is a useful yardstick because it links what investors are paying directly to the company’s current earnings power. In general, faster growth and lower perceived risk justify a higher normal PE ratio, while slower growth or elevated risk argue for a lower one.
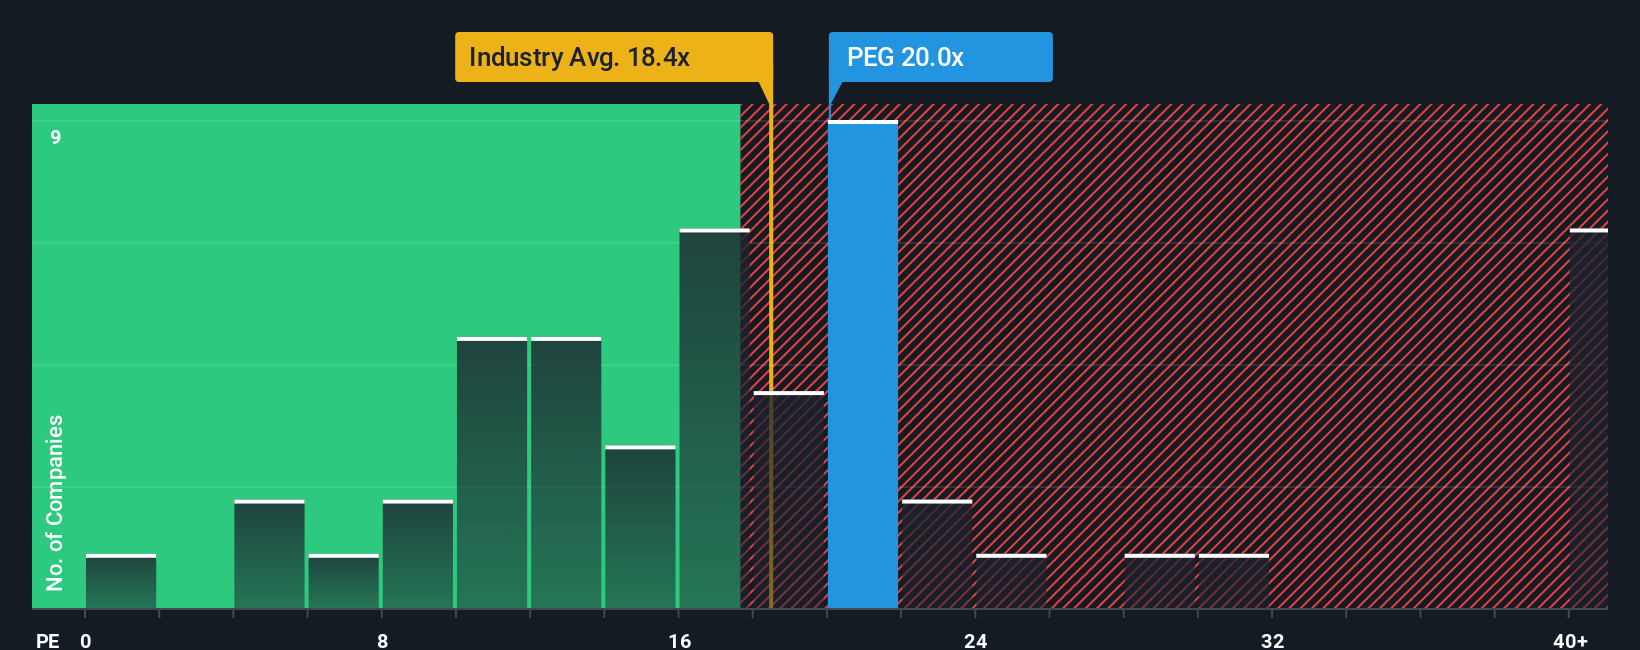
Public Service Enterprise Group is trading on a PE of about 19.3x, slightly above the integrated utilities industry average of roughly 17.8x and broadly in line with the peer group average near 19.2x. Simply Wall St’s proprietary Fair Ratio for the stock is higher, at around 23.0x. This Fair Ratio reflects what investors might reasonably pay given factors such as earnings growth prospects, risk profile, profit margins, industry positioning, and market capitalization, rather than relying purely on blunt peer or sector comparisons.
Because Public Service Enterprise Group’s current PE of 19.3x sits meaningfully below the Fair Ratio of 23.0x, the multiple based view suggests the shares are trading at a discount to what their fundamentals would justify.
Result: UNDERVALUED
PE ratios tell one story, but what if the real opportunity lies elsewhere? Discover 1456 companies where insiders are betting big on explosive growth.
Upgrade Your Decision Making: Choose your Public Service Enterprise Group Narrative
Earlier we mentioned that there is an even better way to understand valuation, so let us introduce you to Narratives. These are simply your story about a company, translated into numbers like future revenue, earnings, margins and a fair value estimate that you can easily build and track on Simply Wall St’s Community page, used by millions of investors.
A Narrative links what you believe about Public Service Enterprise Group’s business, such as how fast data center demand grows or how constructive regulation remains, to a concrete financial forecast and then to a fair value that you can compare directly with today’s share price to decide whether to buy, hold, or sell.
Because Narratives on the platform update dynamically when new information like earnings reports, policy changes, or major grid investment news is released, your view of PEG’s fair value stays live and responsive rather than static and quickly outdated.
For example, one investor might build a bullish PEG Narrative that leans toward the upper end of Street expectations, closer to a $105 fair value. A more cautious investor could anchor on the lower end, around $71, and Narratives allows both perspectives to be clearly quantified, compared and refined over time as new data emerges.
Do you think there's more to the story for Public Service Enterprise Group? Head over to our Community to see what others are saying!
This article by Simply Wall St is general in nature. We provide commentary based on historical data and analyst forecasts only using an unbiased methodology and our articles are not intended to be financial advice. It does not constitute a recommendation to buy or sell any stock, and does not take account of your objectives, or your financial situation. We aim to bring you long-term focused analysis driven by fundamental data. Note that our analysis may not factor in the latest price-sensitive company announcements or qualitative material. Simply Wall St has no position in any stocks mentioned.
Have feedback on this article? Concerned about the content? Get in touch with us directly. Alternatively, email editorial-team@simplywallst.com