
 Nasdaq
 华尔街日报
华尔街日报Are Strong Financial Prospects The Force That Is Driving The Momentum In SP Group A/S' CPH:SPG) Stock?
SP Group (CPH:SPG) has had a great run on the share market with its stock up by a significant 17% over the last month. Given the company's impressive performance, we decided to study its financial indicators more closely as a company's financial health over the long-term usually dictates market outcomes. In this article, we decided to focus on SP Group's ROE.
Return on equity or ROE is an important factor to be considered by a shareholder because it tells them how effectively their capital is being reinvested. Put another way, it reveals the company's success at turning shareholder investments into profits.
How To Calculate Return On Equity?
Return on equity can be calculated by using the formula:
Return on Equity = Net Profit (from continuing operations) ÷ Shareholders' Equity
So, based on the above formula, the ROE for SP Group is:
14% = kr.243m ÷ kr.1.7b (Based on the trailing twelve months to September 2025).
The 'return' refers to a company's earnings over the last year. Another way to think of that is that for every DKK1 worth of equity, the company was able to earn DKK0.14 in profit.
View our latest analysis for SP Group
Why Is ROE Important For Earnings Growth?
We have already established that ROE serves as an efficient profit-generating gauge for a company's future earnings. Depending on how much of these profits the company reinvests or "retains", and how effectively it does so, we are then able to assess a company’s earnings growth potential. Assuming all else is equal, companies that have both a higher return on equity and higher profit retention are usually the ones that have a higher growth rate when compared to companies that don't have the same features.
SP Group's Earnings Growth And 14% ROE
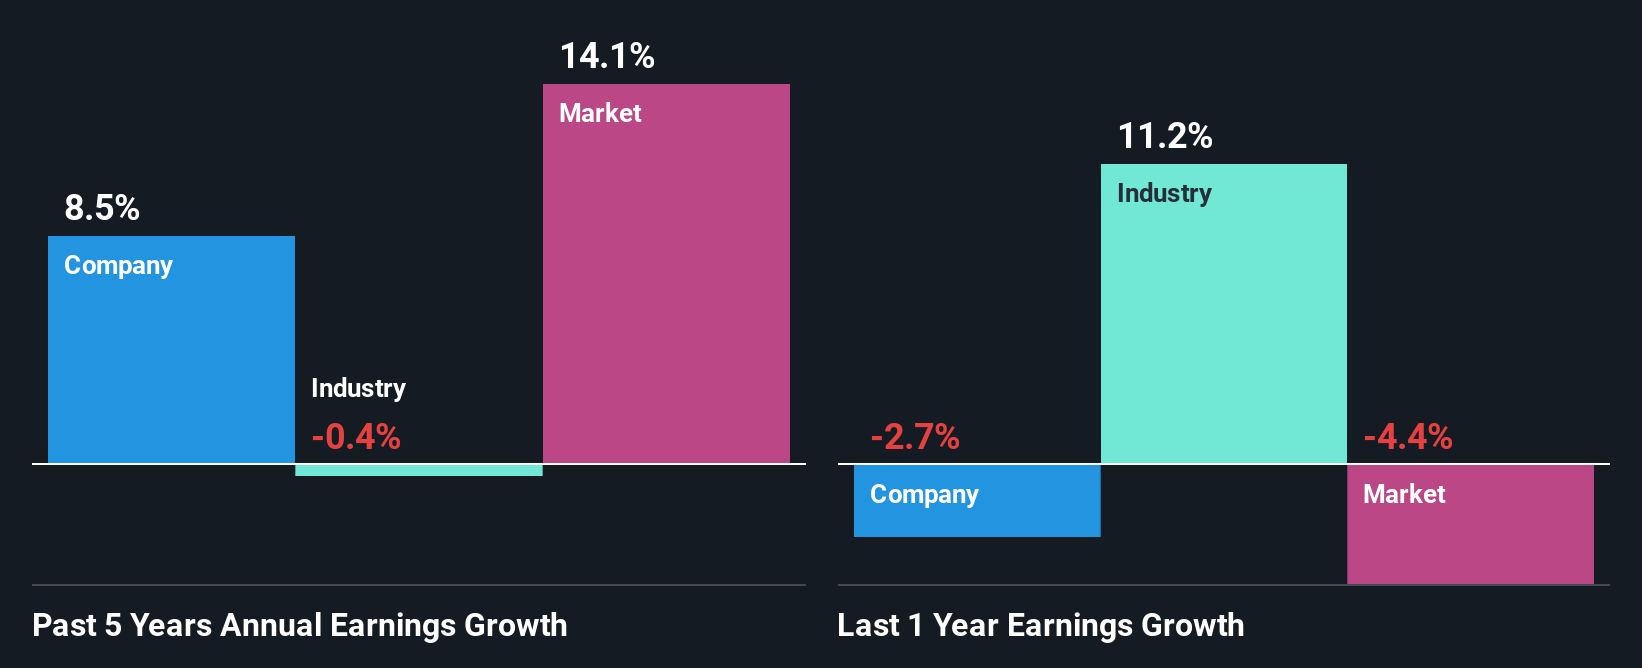
To start with, SP Group's ROE looks acceptable. On comparing with the average industry ROE of 8.9% the company's ROE looks pretty remarkable. This certainly adds some context to SP Group's decent 8.5% net income growth seen over the past five years.
Given that the industry shrunk its earnings at a rate of 0.4% over the last few years, the net income growth of the company is quite impressive.
The basis for attaching value to a company is, to a great extent, tied to its earnings growth. The investor should try to establish if the expected growth or decline in earnings, whichever the case may be, is priced in. By doing so, they will have an idea if the stock is headed into clear blue waters or if swampy waters await. One good indicator of expected earnings growth is the P/E ratio which determines the price the market is willing to pay for a stock based on its earnings prospects. So, you may want to check if SP Group is trading on a high P/E or a low P/E, relative to its industry.
Is SP Group Using Its Retained Earnings Effectively?
SP Group has a low three-year median payout ratio of 19%, meaning that the company retains the remaining 81% of its profits. This suggests that the management is reinvesting most of the profits to grow the business.
Additionally, SP Group has paid dividends over a period of at least ten years which means that the company is pretty serious about sharing its profits with shareholders. Upon studying the latest analysts' consensus data, we found that the company is expected to keep paying out approximately 19% of its profits over the next three years. Therefore, the company's future ROE is also not expected to change by much with analysts predicting an ROE of 17%.
Conclusion
In total, we are pretty happy with SP Group's performance. In particular, it's great to see that the company is investing heavily into its business and along with a high rate of return, that has resulted in a sizeable growth in its earnings. Having said that, looking at the current analyst estimates, we found that the company's earnings are expected to gain momentum. To know more about the company's future earnings growth forecasts take a look at this free report on analyst forecasts for the company to find out more.
Have feedback on this article? Concerned about the content? Get in touch with us directly. Alternatively, email editorial-team (at) simplywallst.com.
This article by Simply Wall St is general in nature. We provide commentary based on historical data and analyst forecasts only using an unbiased methodology and our articles are not intended to be financial advice. It does not constitute a recommendation to buy or sell any stock, and does not take account of your objectives, or your financial situation. We aim to bring you long-term focused analysis driven by fundamental data. Note that our analysis may not factor in the latest price-sensitive company announcements or qualitative material. Simply Wall St has no position in any stocks mentioned.