
 Nasdaq
 华尔街日报
华尔街日报Is There Still Value in Tenet Healthcare After Its 57% 2025 Rally?
- Wondering if Tenet Healthcare's huge run up has already priced in the upside, or if there is still value left on the table for new investors?
- The stock has eased back about 2.5% over the last week, but is still up 2.1% over 30 days and 57.2% year to date, building on a 48.5% gain over 1 year and more than tripling over 3 and 5 years.
- Recent headlines have focused on Tenet's continued strategic focus on its ambulatory surgery and specialty care network, along with ongoing portfolio streamlining to sharpen its operating focus. These moves have helped shape investor expectations around long term growth, capital allocation discipline, and the stability of its cash flows.
- Despite the strong share price performance, Tenet currently scores a 6/6 valuation check score, suggesting the market may still be underestimating its intrinsic value. Next we will unpack what different valuation approaches say about Tenet, before finishing with a more holistic way to think about whether the stock may be attractive at these levels.
Approach 1: Tenet Healthcare Discounted Cash Flow (DCF) Analysis
A Discounted Cash Flow model estimates what a company is worth today by projecting the cash it can generate in the future and then discounting those cash flows back to their value in the present.
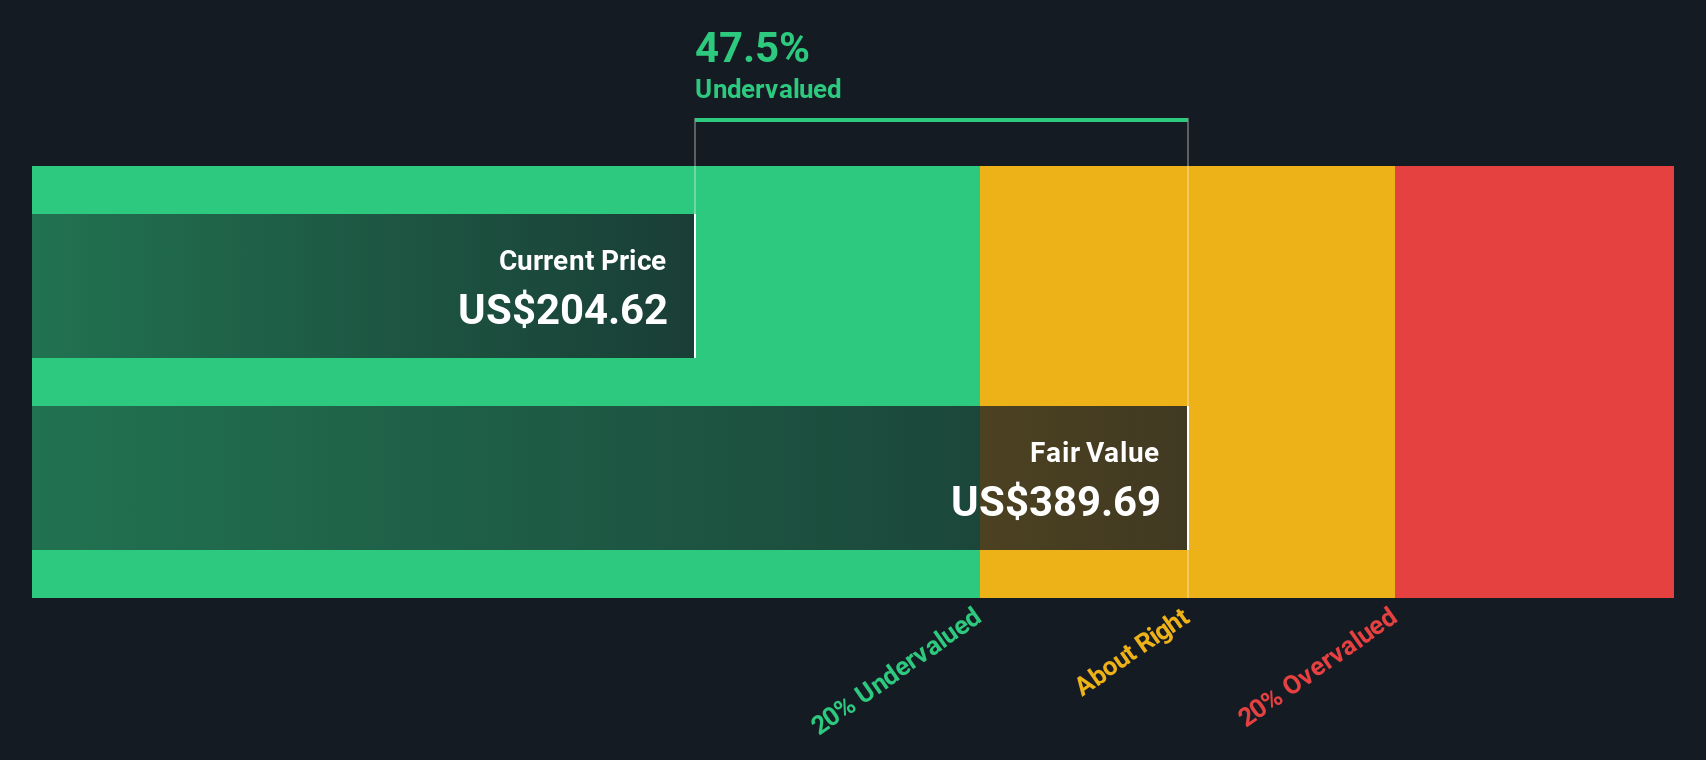
For Tenet Healthcare, the latest twelve month free cash flow is about $1.60 billion, and analysts expect it to remain around $1.50 billion in 2026. Simply Wall St then extrapolates these analyst forecasts over the next decade, with projected free cash flow staying in a relatively tight band near $1.5 billion to $1.7 billion through 2035. Each future year is then discounted back to reflect risk and the time value of money.
Aggregating these discounted cash flows produces an estimated intrinsic value of about $370.53 per share. Compared with the current market price, this implies the stock trades at roughly a 46.9% discount to its DCF based fair value, suggesting investors are not fully pricing in Tenet Healthcare's future cash generation.
Result: UNDERVALUED
Our Discounted Cash Flow (DCF) analysis suggests Tenet Healthcare is undervalued by 46.9%. Track this in your watchlist or portfolio, or discover 912 more undervalued stocks based on cash flows.
Approach 2: Tenet Healthcare Price vs Earnings
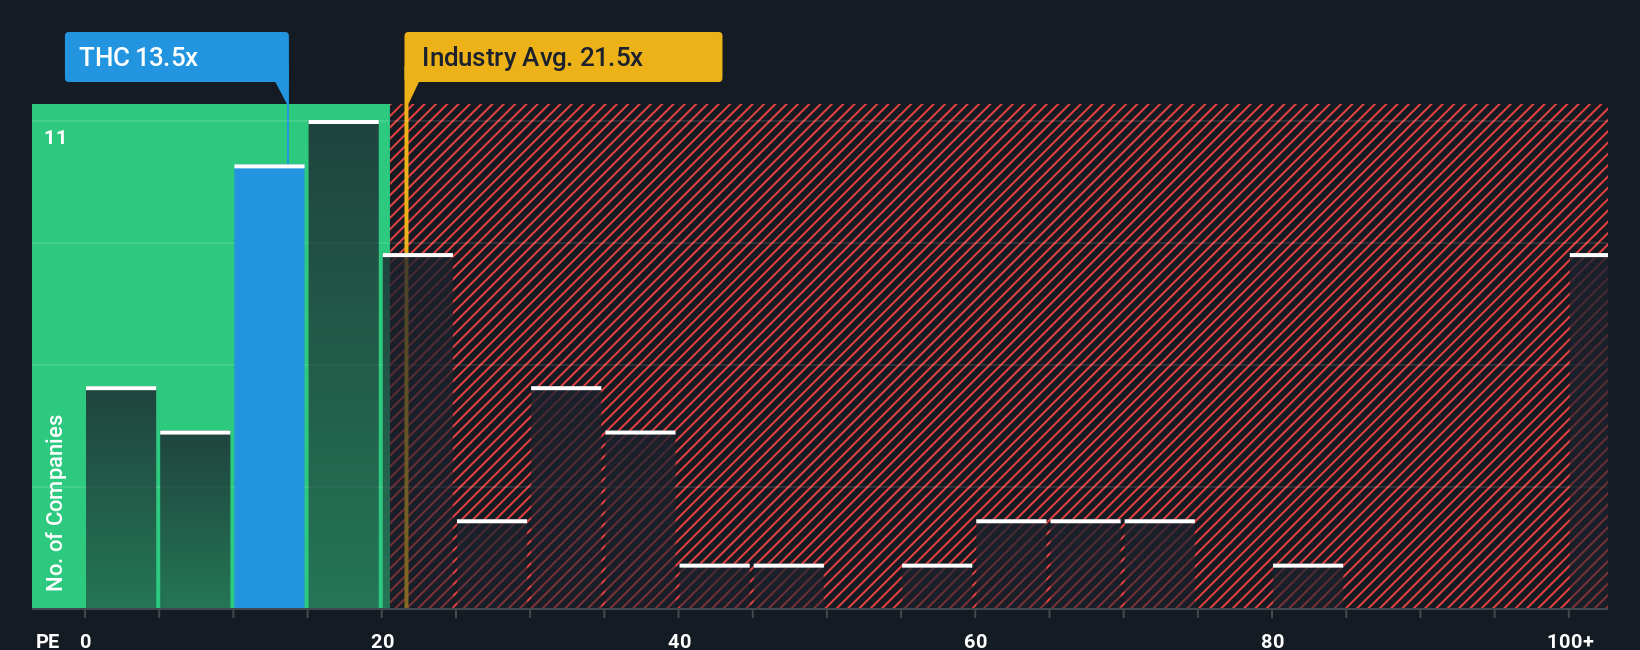
For consistently profitable companies like Tenet Healthcare, the price to earnings, or PE, ratio is a useful way to judge value because it directly compares what investors pay for each dollar of current earnings. In general, faster growing and lower risk businesses can justify a higher PE, while slower growth and higher uncertainty usually call for a lower, more conservative multiple.
Tenet currently trades on a PE of about 12.8x. That is well below the broader Healthcare industry average of around 23.6x and also under the peer group average of roughly 23.2x, suggesting the market is valuing Tenet at a discount despite its strong operating momentum. On the surface, this points to potential upside if sentiment or earnings expectations continue to improve.
Simply Wall St takes this a step further with its proprietary Fair Ratio. This metric estimates what Tenet's PE should be based on factors such as earnings growth, profit margins, risk profile, industry and market cap. For Tenet, the Fair Ratio is about 24.3x, meaning the shares trade at roughly half of what this framework suggests is reasonable. Because the Fair Ratio fully adjusts for growth and risk rather than just comparing raw multiples, it can provide a more tailored view of value, and it indicates Tenet looks undervalued on an earnings basis.
Result: UNDERVALUED
PE ratios tell one story, but what if the real opportunity lies elsewhere? Discover 1462 companies where insiders are betting big on explosive growth.
Upgrade Your Decision Making: Choose your Tenet Healthcare Narrative
Earlier we mentioned that there is an even better way to understand valuation, so let us introduce you to Narratives, a simple way to connect your view of Tenet Healthcare with the numbers behind it. A Narrative is your story about the company, captured as assumptions about its future revenue growth, profit margins and risk, which then flow into a forecast and a fair value estimate. Instead of just relying on static multiples, Narratives link what you believe about Tenet Healthcare's strategy, competitive position and industry trends directly to a living financial model. On Simply Wall St, millions of investors use Narratives on the Community page to see how their fair value compares to the current share price and decide how the stock might fit into their portfolio today. As new news, earnings or guidance arrive, Narratives update dynamically, helping you react to fresh information without rebuilding your analysis from scratch. For example, one Tenet Healthcare Narrative might assume conservative growth and see only modest potential, while another expects stronger outpatient expansion and sees significantly more potential from the current price.
Do you think there's more to the story for Tenet Healthcare? Head over to our Community to see what others are saying!

This article by Simply Wall St is general in nature. We provide commentary based on historical data and analyst forecasts only using an unbiased methodology and our articles are not intended to be financial advice. It does not constitute a recommendation to buy or sell any stock, and does not take account of your objectives, or your financial situation. We aim to bring you long-term focused analysis driven by fundamental data. Note that our analysis may not factor in the latest price-sensitive company announcements or qualitative material. Simply Wall St has no position in any stocks mentioned.
Have feedback on this article? Concerned about the content? Get in touch with us directly. Alternatively, email editorial-team@simplywallst.com