
 Nasdaq
 华尔街日报
华尔街日报Does SEB Still Offer Value After Strong 2024 Share Price Gains?
- If you are wondering whether Skandinaviska Enskilda Banken is still good value after its strong run, you are not alone, as this is exactly the kind of stock where a closer look at valuation really matters.
- The share price has cooled slightly over the last week, slipping about 0.6%, but it is still up 4.3% over 30 days, 23.9% year to date and 31.6% over the past year, with multi year gains above 200% suggesting investors have steadily rerated the bank.
- Those moves have come as Nordic financials have broadly benefited from higher interest rate environments and improving return on equity metrics, with SEB often cited in market commentary as one of the region's more conservatively run banks. At the same time, ongoing discussions around capital requirements and digital banking investment have kept a spotlight on how resilient and efficiently run its balance sheet is.
- Right now SEB scores just 2 out of 6 on our valuation checks, which means it only screens as undervalued on a minority of metrics. We will unpack what different valuation approaches say about the stock next, then finish by looking at a more powerful way to tie those numbers into the bigger investment story.
Skandinaviska Enskilda Banken scores just 2/6 on our valuation checks. See what other red flags we found in the full valuation breakdown.
Approach 1: Skandinaviska Enskilda Banken Excess Returns Analysis
The Excess Returns model looks at how much value Skandinaviska Enskilda Banken can create over and above the return that shareholders demand, then capitalizes those surplus profits into an intrinsic value per share.
For SEB, the starting point is a Book Value of SEK112.88 per share, expected to grow to a Stable Book Value of SEK122.79 per share, based on weighted future estimates from 10 analysts. On this equity base, analysts expect Stable EPS of SEK17.11 per share, implying an Average Return on Equity of 13.94%.
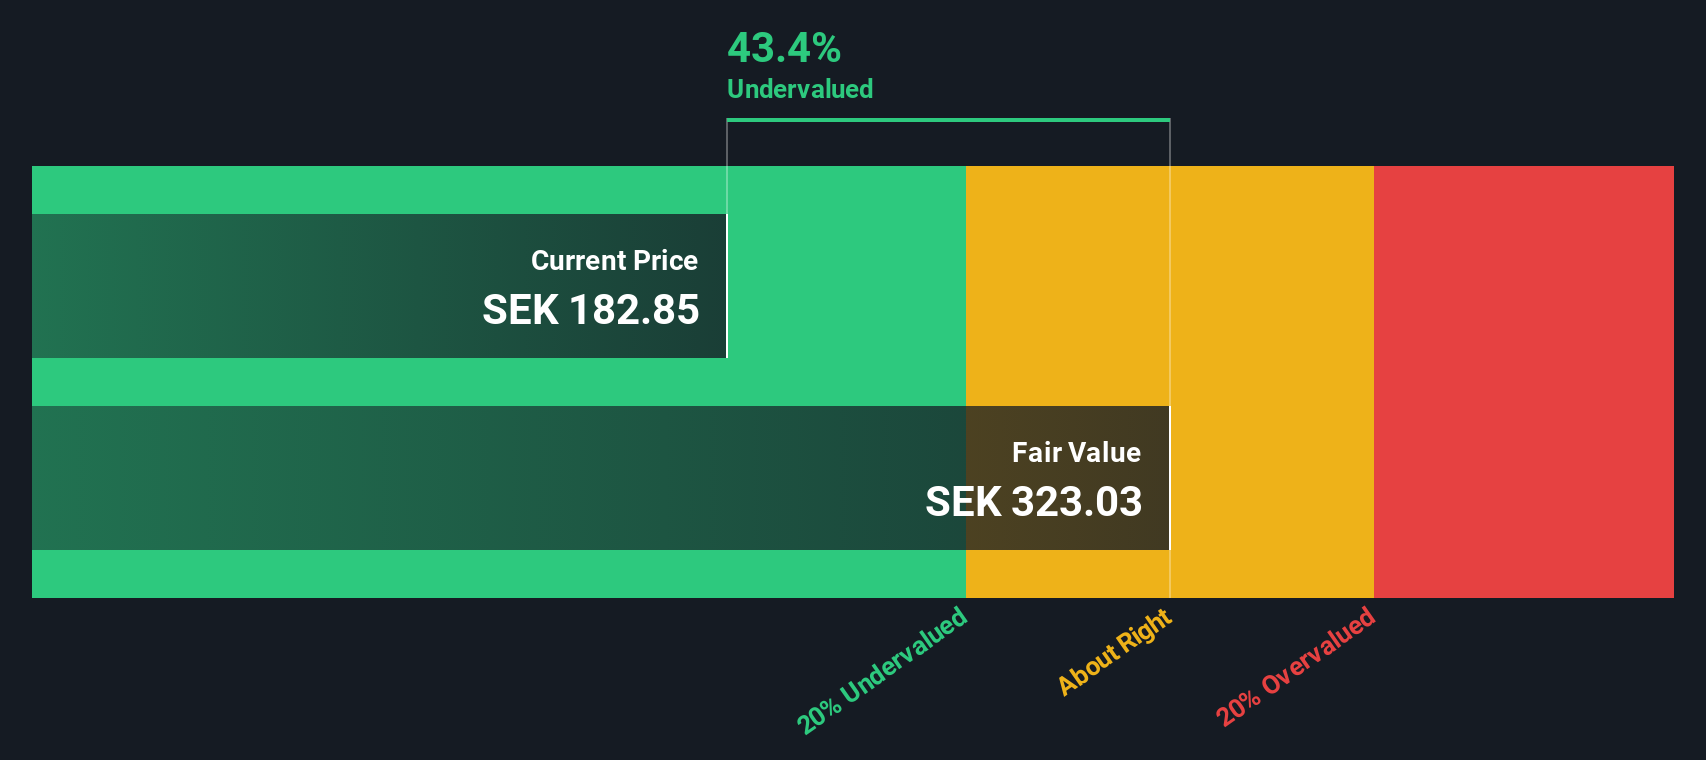
The model assumes a Cost of Equity of SEK7.61 per share, so SEB is projected to generate Excess Return of SEK9.51 per share, a meaningful spread over its funding cost. When these excess returns are projected and discounted, they imply an intrinsic value of about SEK334 per share, meaning the stock screens as roughly 43.4% undervalued versus the current market price.
This indicates that investors may not be fully accounting for SEB’s ability to compound value on its equity base.
Result: UNDERVALUED
Our Excess Returns analysis suggests Skandinaviska Enskilda Banken is undervalued by 43.4%. Track this in your watchlist or portfolio, or discover 912 more undervalued stocks based on cash flows.
Approach 2: Skandinaviska Enskilda Banken Price vs Earnings
For a consistently profitable bank like SEB, the price to earnings ratio is a useful yardstick because it links what investors pay today to the earnings power the business is already generating. In practice, investors are usually willing to pay a higher PE when they expect stronger growth or see lower risk, and a lower PE when growth looks subdued or the outlook is more uncertain.
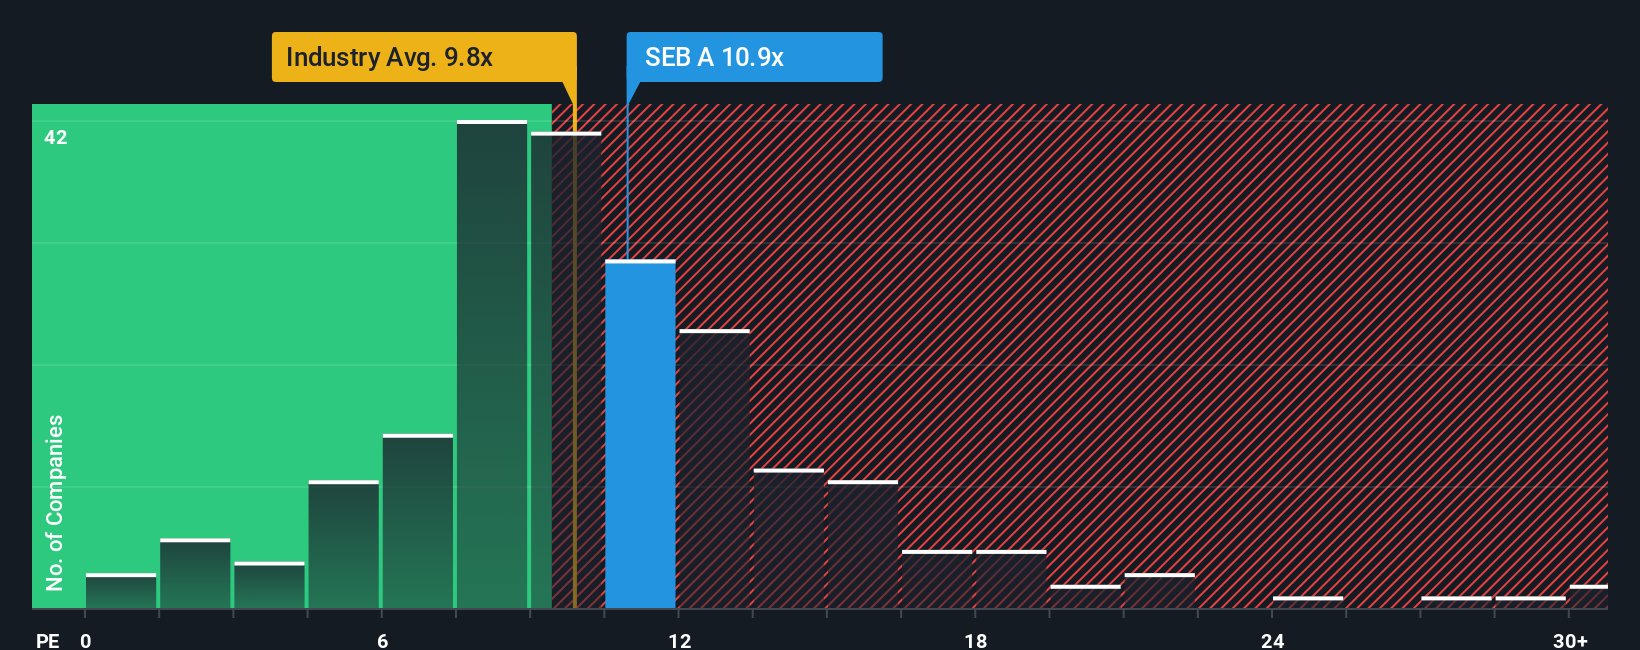
SEB currently trades on a PE of about 12x, which is slightly above both the global Banks industry average of around 10.8x and very close to its Nordic peer group at roughly 11.9x. On the surface that suggests the stock is priced broadly in line with similar banks.
Simply Wall St’s Fair Ratio framework goes a step further by asking what PE SEB should trade on, given its specific mix of earnings growth, profitability, risk profile, industry and market cap. For SEB, this proprietary model points to a Fair PE of about 11.7x, only marginally below the current 12x. That narrow gap implies the market is valuing SEB almost exactly in line with its fundamentals.
Result: ABOUT RIGHT
PE ratios tell one story, but what if the real opportunity lies elsewhere? Discover 1462 companies where insiders are betting big on explosive growth.
Upgrade Your Decision Making: Choose your Skandinaviska Enskilda Banken Narrative
Earlier we mentioned that there is an even better way to understand valuation, so let us introduce Narratives, which are simple stories that express your view of a company by connecting your assumptions about its future revenue, earnings and margins to a financial forecast and, ultimately, a fair value you can compare with today’s share price.
On Simply Wall St’s Community page, millions of investors use Narratives as an easy, accessible tool to spell out why they think a business will outperform or struggle, then translate that story into numbers that update dynamically as new news, earnings or guidance comes in.
For Skandinaviska Enskilda Banken, for example, a more optimistic Narrative might focus on AI driven efficiency gains, resilient fee income and disciplined buybacks to justify a fair value closer to SEK190 per share. A cautious Narrative could instead focus on regulatory costs, margin pressure and slower activity, pointing to a fair value nearer SEK151. By comparing each Narrative’s evolving fair value with the current price, you can assess how SEB looks under the story you believe.
Do you think there's more to the story for Skandinaviska Enskilda Banken? Head over to our Community to see what others are saying!

This article by Simply Wall St is general in nature. We provide commentary based on historical data and analyst forecasts only using an unbiased methodology and our articles are not intended to be financial advice. It does not constitute a recommendation to buy or sell any stock, and does not take account of your objectives, or your financial situation. We aim to bring you long-term focused analysis driven by fundamental data. Note that our analysis may not factor in the latest price-sensitive company announcements or qualitative material. Simply Wall St has no position in any stocks mentioned.
Have feedback on this article? Concerned about the content? Get in touch with us directly. Alternatively, email editorial-team@simplywallst.com