
 Nasdaq
 华尔街日报
华尔街日报Is Albemarle’s 58.1% Rally in 2025 Justified by Its Lithium Growth Prospects?
- Wondering if Albemarle is finally a smart way to play the lithium story without overpaying for hype? You are not alone; this stock is back on a lot of watchlists.
- After a rough few years, Albemarle has bounced with a 1.1% gain over the last week, 14.5% over the last month, 58.1% year to date, and 51.9% over the last year, even though the 3 year and 5 year returns are still negative at -39.5% and -4.7%.
- Much of this renewed interest links back to shifting expectations around long term lithium demand and supply discipline, as investors reprice the stock for a world where EV adoption, grid storage, and battery technology keep expanding. At the same time, ongoing headlines about permitting, geopolitical competition in critical minerals, and policy support for domestic supply chains are adding both excitement and uncertainty to Albemarle's outlook.
- Despite the rebound, Albemarle only scores 1/6 on our valuation checks, suggesting the market may still be pricing in a lot of optimism. Next, we will walk through different valuation approaches, and then finish with a more nuanced way to think about what the stock is really worth.
Albemarle scores just 1/6 on our valuation checks. See what other red flags we found in the full valuation breakdown.
Approach 1: Albemarle Discounted Cash Flow (DCF) Analysis
A Discounted Cash Flow model estimates what a company is worth by projecting the cash it can generate in the future and discounting those cash flows back to today in $ terms.
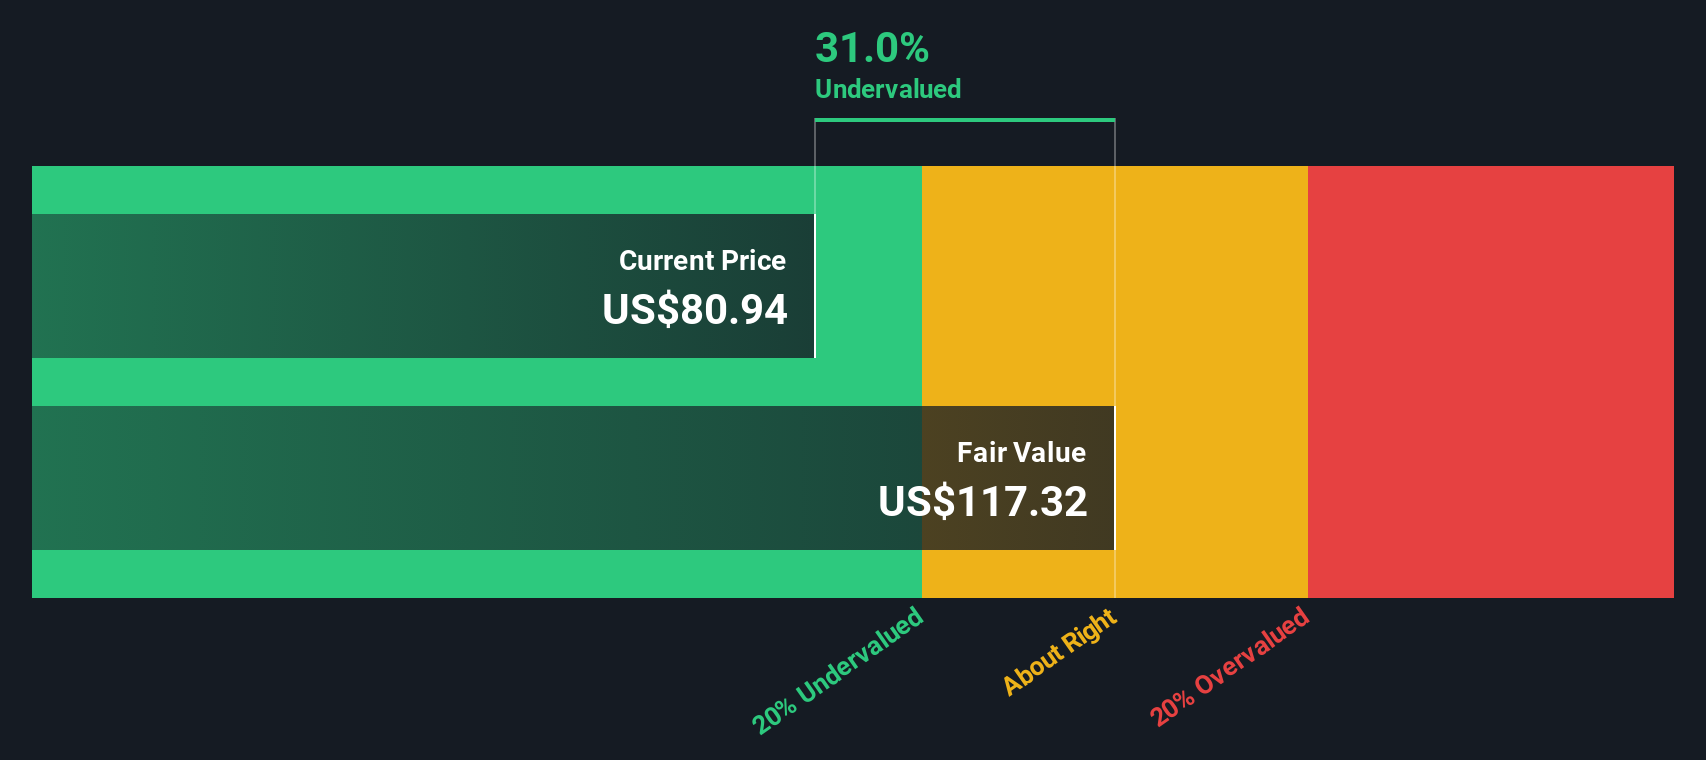
For Albemarle, the starting point is a last twelve month free cash flow of about $190 Million in the red, reflecting heavy investment and volatile lithium pricing. Analysts then expect free cash flow to turn positive and ramp up, with Simply Wall St extending those forecasts so that projected free cash flow reaches roughly $1.1 Billion by 2035. The 2 Stage Free Cash Flow to Equity model assumes faster growth in the earlier years before fading to a more sustainable pace further out.
When those future $ cash flows are discounted back, the resulting intrinsic value comes out at about $140.11 per share. That is roughly 3.9% above the current share price, implying the stock is modestly undervalued rather than a deep bargain.
Result: ABOUT RIGHT
Albemarle is fairly valued according to our Discounted Cash Flow (DCF), but this can change at a moment's notice. Track the value in your watchlist or portfolio and be alerted on when to act.
Approach 2: Albemarle Price vs Sales
For a cyclical materials company like Albemarle, where earnings swing with commodity prices, the Price to Sales multiple is often a cleaner way to value the business than earnings based metrics. Sales tend to be more stable than profits, so this ratio can give a better sense of what the market is paying for each dollar of Albemarle’s lithium exposure through the cycle.
In general, faster and more reliable growth, stronger margins, and lower risk justify a higher sales multiple, while slower growth or elevated risk pull it down. Albemarle currently trades on about 3.21x sales, well above the Chemicals industry average of around 1.14x and above the peer group average of roughly 2.22x. That gap suggests investors are already paying a premium for its growth profile and strategic position in lithium.
Simply Wall St’s Fair Ratio framework takes this a step further by estimating what Albemarle’s Price to Sales multiple should be, given its expected growth, profitability, risk profile, industry, and size. For Albemarle, the Fair Ratio comes out to about 1.24x, meaning the current 3.21x looks rich versus what its fundamentals justify.
Result: OVERVALUED
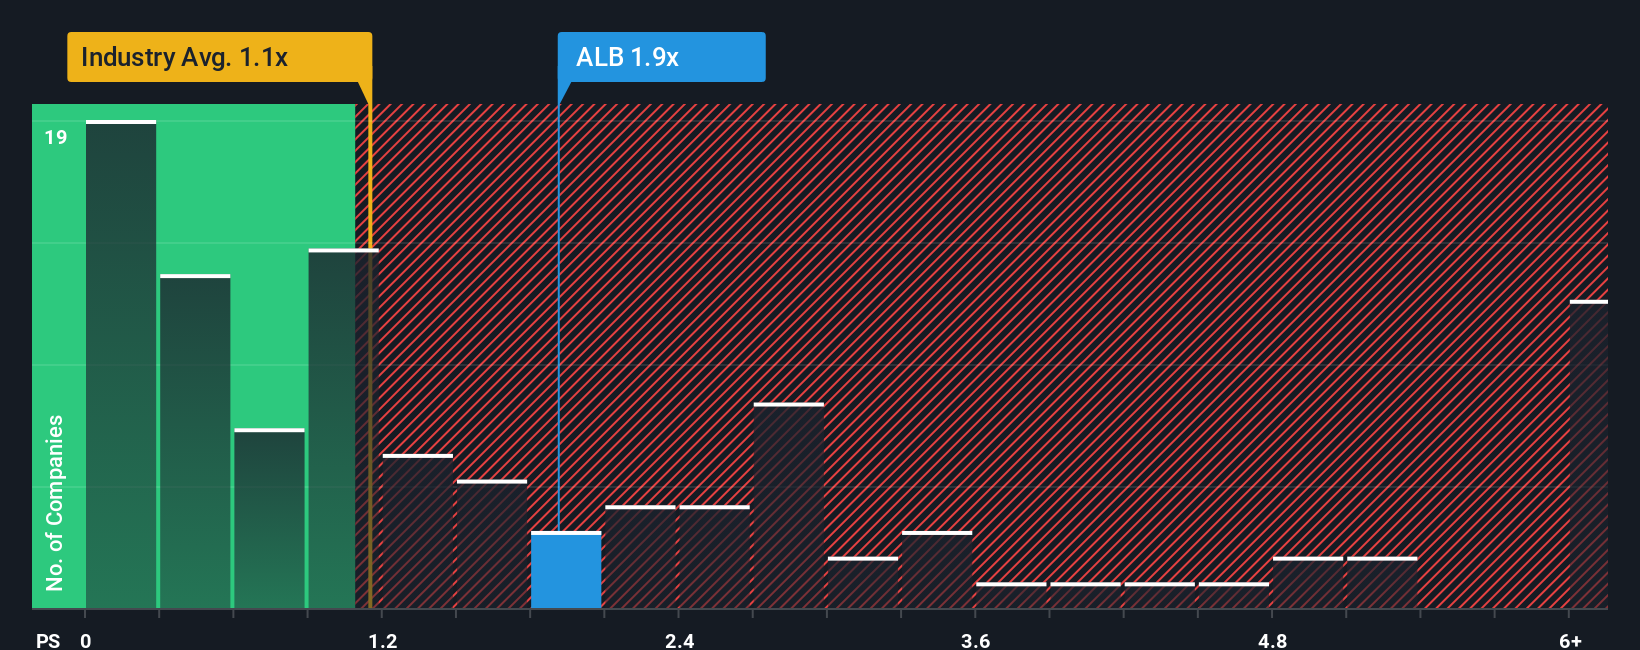
PS ratios tell one story, but what if the real opportunity lies elsewhere? Discover 1462 companies where insiders are betting big on explosive growth.
Upgrade Your Decision Making: Choose your Albemarle Narrative
Earlier we mentioned that there is an even better way to understand valuation, so let us introduce you to Narratives, a simple way to connect the story you believe about Albemarle with the numbers behind its future revenue, earnings, margins, and ultimately its fair value. A Narrative is your structured perspective on the company, translated into a financial forecast and then into a fair value that you can directly compare with today’s share price to judge whether to buy, hold, or sell. On Simply Wall St, Narratives live in the Community page and are used by millions of investors as an easy, accessible tool that updates dynamically when new information like news, guidance, or earnings is released. For Albemarle, one investor might build a bullish Narrative that assumes lithium prices recover quickly and justify a fair value near the higher end of recent targets around $200. A more cautious investor might assume prolonged price weakness and see fair value closer to the low end, near $58. Narratives make those differences transparent and comparable in one place.
Do you think there's more to the story for Albemarle? Head over to our Community to see what others are saying!

This article by Simply Wall St is general in nature. We provide commentary based on historical data and analyst forecasts only using an unbiased methodology and our articles are not intended to be financial advice. It does not constitute a recommendation to buy or sell any stock, and does not take account of your objectives, or your financial situation. We aim to bring you long-term focused analysis driven by fundamental data. Note that our analysis may not factor in the latest price-sensitive company announcements or qualitative material. Simply Wall St has no position in any stocks mentioned.
Have feedback on this article? Concerned about the content? Get in touch with us directly. Alternatively, email editorial-team@simplywallst.com