
 Nasdaq
 华尔街日报
华尔街日报Is It Too Late To Reassess Millicom After Its 112.3% Surge In 2025?
- If you are wondering whether Millicom International Cellular is still a bargain after its big run, you are not alone. This article is going to unpack whether the current price really matches the underlying value.
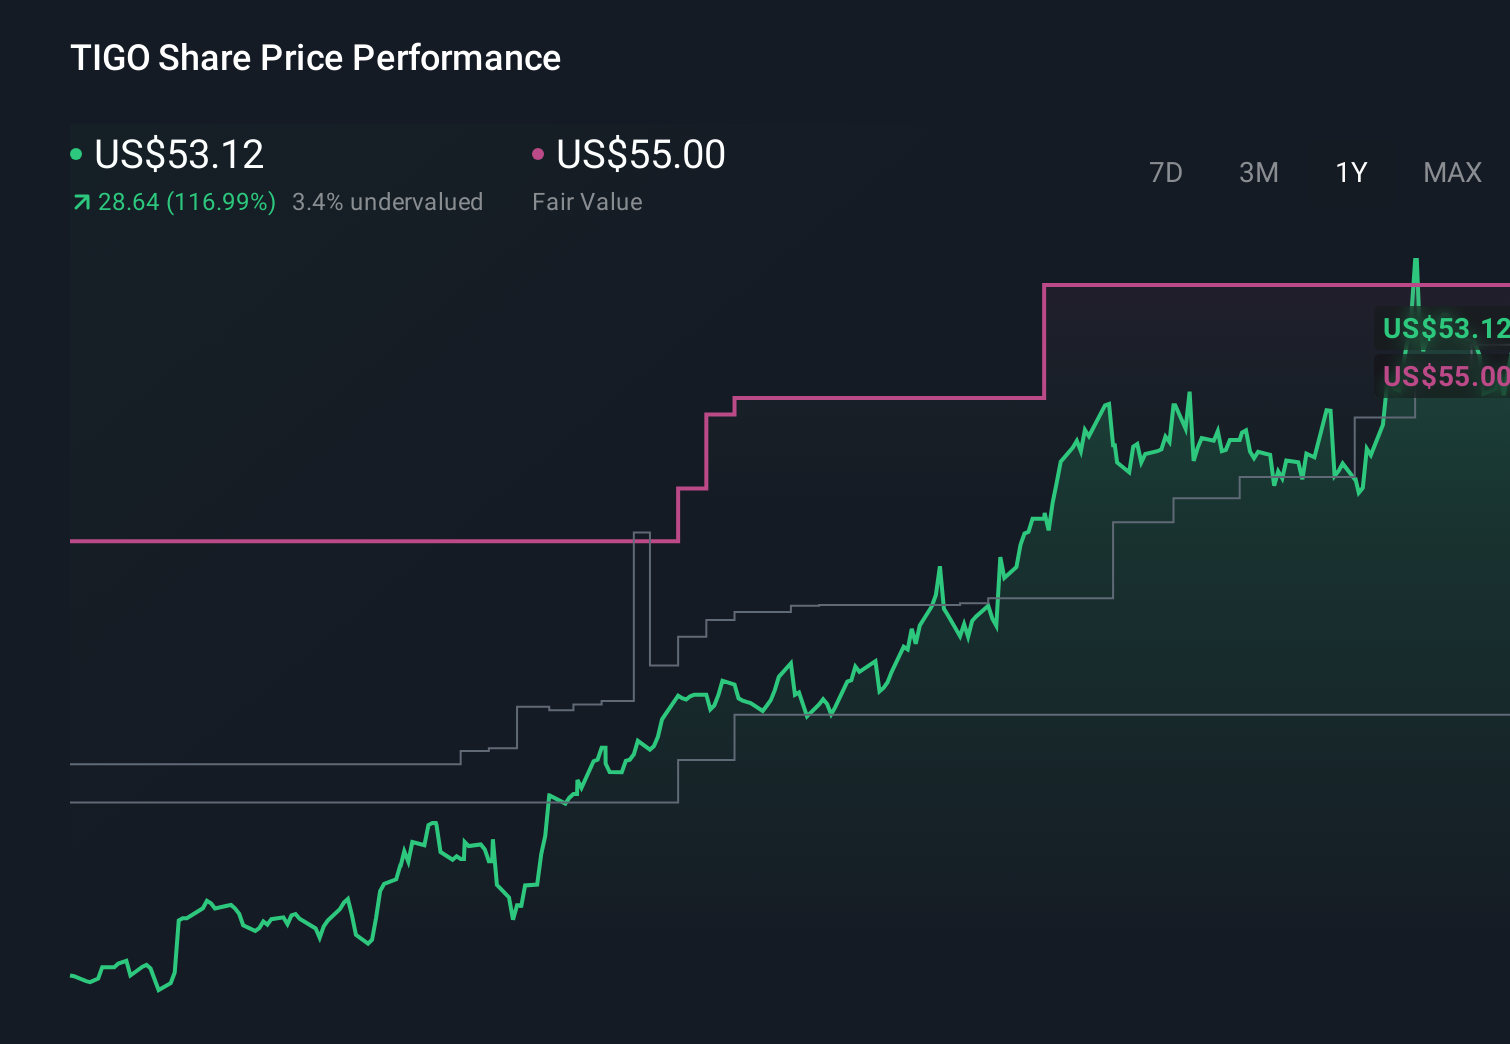
- The stock has climbed to around $53.34, delivering roughly 4.3% over the last week, 6.0% over the last month, and an eye catching 112.3% year to date, with a huge 144.5% gain over the past year and 369.6% over 3 years.
- Those moves have come as investors react to ongoing strategic shifts in Millicom’s Latin American telecom footprint and a tighter focus on core mobile and broadband operations. The market often views this as improving long term visibility and cash generation. In parallel, sentiment around emerging market telecom infrastructure has improved, with capital increasingly gravitating toward companies that can turn network investments into durable, local currency cash flows.
- Despite that rally, Millicom still scores a solid 5 out of 6 on our valuation checks, suggesting the market may not be fully pricing in its fundamentals yet. Next, we will walk through what different valuation approaches say about the stock, and then finish with a more holistic way to think about value that goes beyond the usual multiples and models.
Approach 1: Millicom International Cellular Discounted Cash Flow (DCF) Analysis
A Discounted Cash Flow model estimates what a business is worth by projecting the cash it can generate in the future and discounting those cash flows back to today. For Millicom International Cellular, the model uses a 2 Stage Free Cash Flow to Equity approach based on $794.9 Million in last twelve month free cash flow.
Analysts provide cash flow estimates for the next few years and, from there, Simply Wall St extrapolates a longer path. For example, free cash flow is projected at about $775 Million in 2026, easing to around $636.4 Million by 2035, with each future figure discounted to reflect risk and the time value of money.
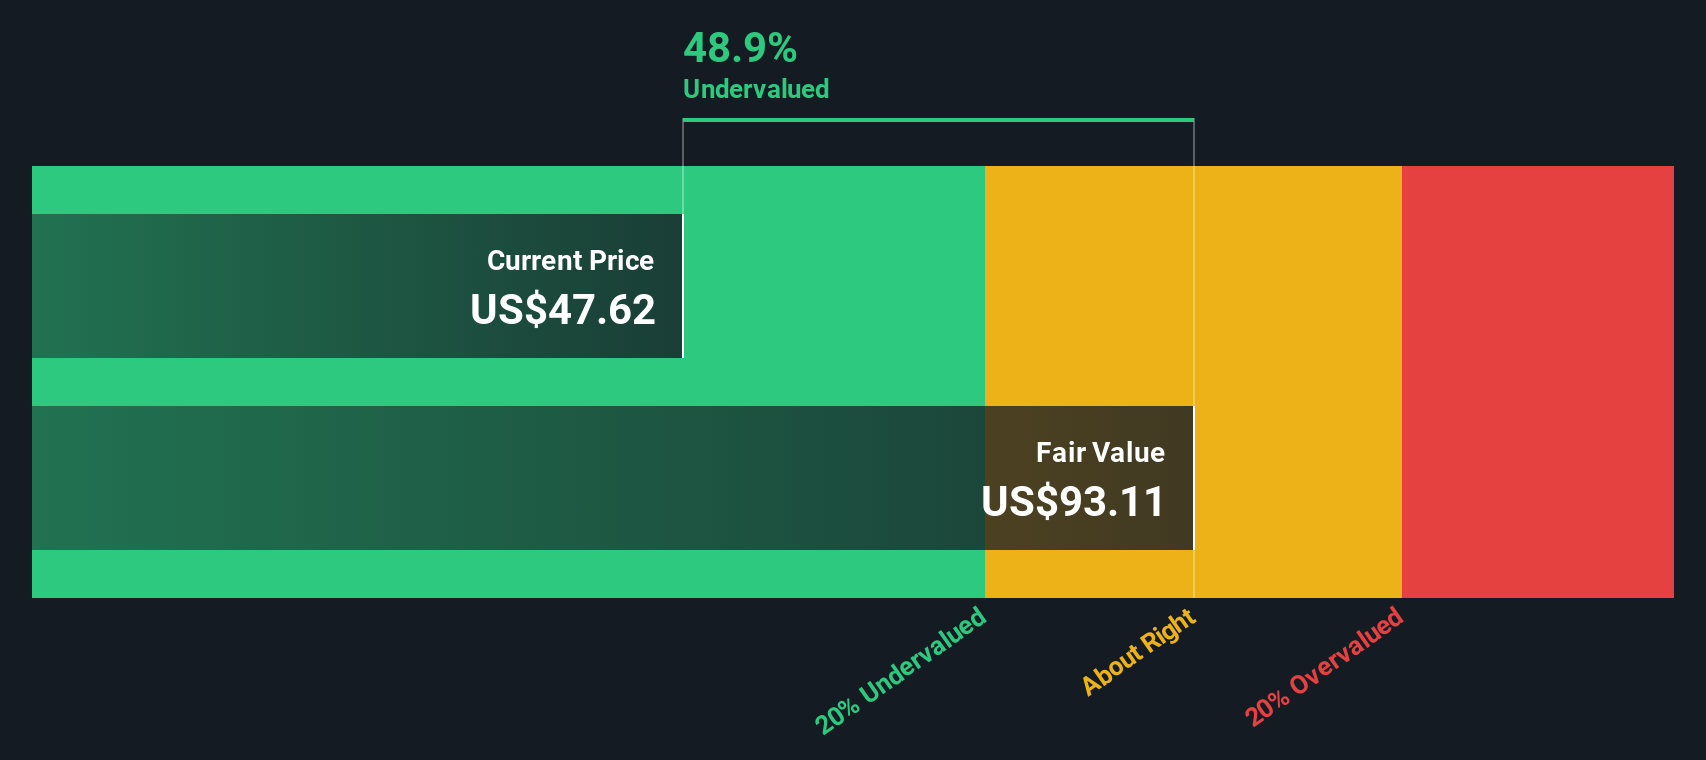
Rolling up these discounted projections results in an estimated intrinsic value of roughly $88.81 per share. Compared with the recent share price around $53.34, the DCF implies the stock is about 39.9% undervalued. This indicates the market is still applying a sizable discount to Millicom’s long term cash generation potential.
Result: UNDERVALUED
Our Discounted Cash Flow (DCF) analysis suggests Millicom International Cellular is undervalued by 39.9%. Track this in your watchlist or portfolio, or discover 910 more undervalued stocks based on cash flows.
Approach 2: Millicom International Cellular Price vs Earnings
For profitable companies like Millicom, the price to earnings, or PE, ratio is a straightforward way to gauge how much investors are paying for each dollar of current earnings. In general, faster growth and lower risk justify a higher PE, while slower growth or higher risk argue for a lower, more conservative multiple.
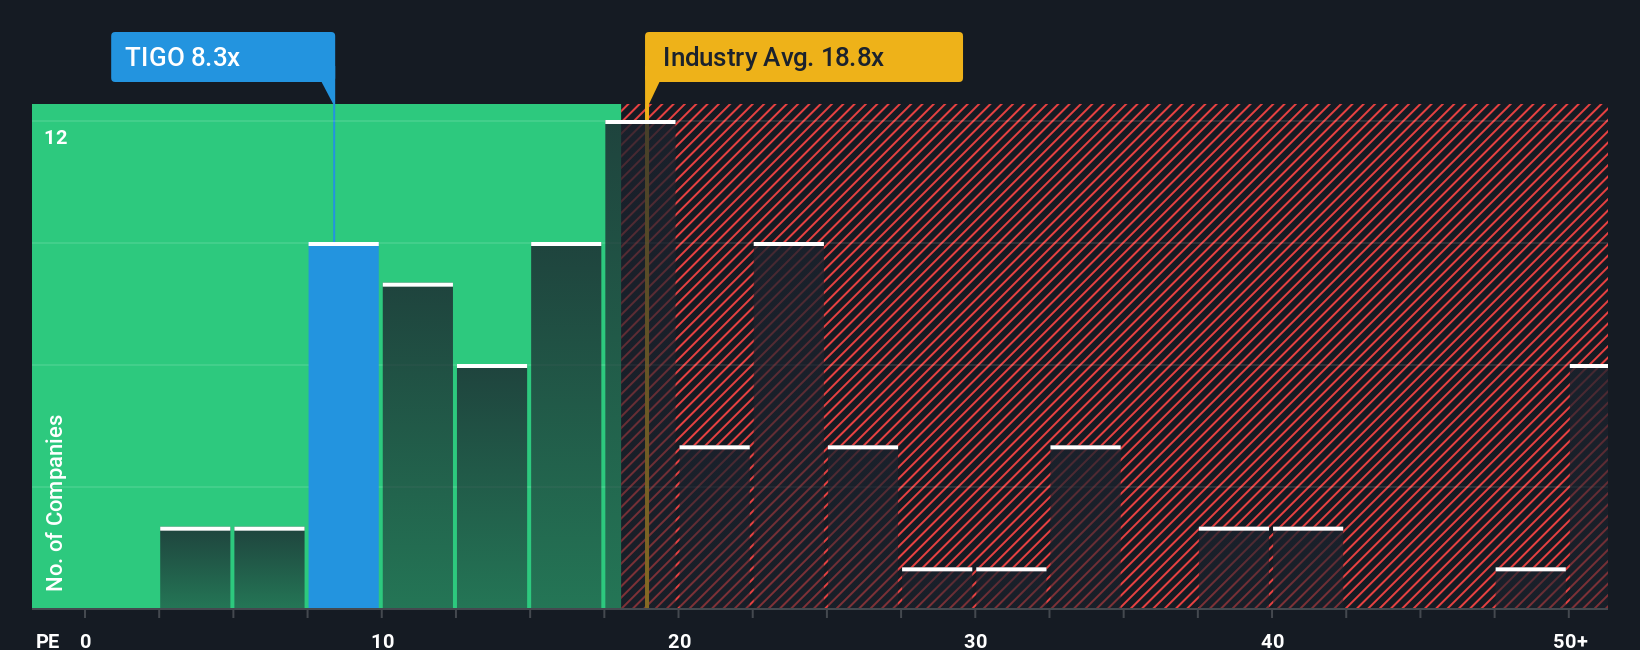
Millicom currently trades on a PE of about 8.1x, which is well below both the Wireless Telecom industry average of roughly 17.6x and a broader peer group average of around 33.4x. On the surface, that discount suggests the market is still cautious about the stock despite its strong run.
Simply Wall St’s Fair Ratio framework estimates that, given Millicom’s earnings growth profile, profitability, industry, size and risk factors, a more appropriate PE would be closer to 9.4x. This Fair Ratio is more tailored than simple peer or industry comparisons because it explicitly adjusts for the company’s own fundamentals rather than assuming it should trade in line with averages. With the current PE of 8.1x sitting below the 9.4x Fair Ratio, the multiple based view points to further upside.
Result: UNDERVALUED
PE ratios tell one story, but what if the real opportunity lies elsewhere? Discover 1463 companies where insiders are betting big on explosive growth.
Upgrade Your Decision Making: Choose your Millicom International Cellular Narrative
Earlier we mentioned that there is an even better way to understand valuation, so let us introduce you to Narratives, a simple way to connect your view of a company’s story with concrete forecasts for its future revenue, earnings, margins and ultimately its fair value. A Narrative is your own, structured story about Millicom International Cellular, where you spell out why you think its Latin American strategy, competitive landscape, capital intensity and currency risks will play out a certain way, and then link that story to numbers in a forecast that produces a fair value you can compare with today’s share price to inform your decision on whether to buy, hold or sell. Narratives on Simply Wall St, available to millions of investors on each company’s Community page, update dynamically as new information like earnings results, network investments or regulatory changes emerge, so your story and fair value stay aligned with reality. For example, one Millicom Narrative might assume stronger postpaid growth, rising data demand and disciplined capex that support a fair value near the top of analyst targets around $63, while another more cautious Narrative might focus on competition, FX volatility and margin pressure to justify a fair value closer to the low end near $36.
Do you think there's more to the story for Millicom International Cellular? Head over to our Community to see what others are saying!
This article by Simply Wall St is general in nature. We provide commentary based on historical data and analyst forecasts only using an unbiased methodology and our articles are not intended to be financial advice. It does not constitute a recommendation to buy or sell any stock, and does not take account of your objectives, or your financial situation. We aim to bring you long-term focused analysis driven by fundamental data. Note that our analysis may not factor in the latest price-sensitive company announcements or qualitative material. Simply Wall St has no position in any stocks mentioned.
Have feedback on this article? Concerned about the content? Get in touch with us directly. Alternatively, email editorial-team@simplywallst.com