
 Nasdaq
 华尔街日报
华尔街日报A Look at W. P. Carey’s (WPC) Valuation After Its Recent Share Price Pullback
W. P. Carey (WPC) has quietly pulled back over the past month even though its year to date return and 1 year total return are both still comfortably positive, creating an interesting entry point.
See our latest analysis for W. P. Carey.
At around $64.97, the recent 1 month share price pullback contrasts sharply with W. P. Carey’s strong year to date share price return and solid 1 year total shareholder return, suggesting momentum has cooled a little but not reversed.
If W. P. Carey has you thinking about where to find the next opportunity, now is a good moment to explore fast growing stocks with high insider ownership.
With shares still up strongly over the past year but now trading below analyst targets and at a steep implied intrinsic discount, investors may be asking two key questions: Is W. P. Carey quietly offering a value opportunity, or is the market already pricing in its future growth?
Most Popular Narrative: 5.8% Undervalued
With W. P. Carey last closing at $64.97 against a narrative fair value of $69.00, the story centers on solid income resilience rather than explosive growth.
Strong lease structures and active asset management drive resilient rent increases, margin expansion, and support for future dividend potential. Active balance sheet management, including high spreads (100-150 bps) between disposition and investment cap rates, allows accretive reinvestment from non-core asset sales (e.g., self-storage) into higher-yielding, long-term net lease assets, providing a catalyst for net margin expansion and AFFO growth.
Curious how steady rent escalators, shifting asset mix, and richer margins combine into that fair value figure? The narrative blends disciplined growth assumptions with an earnings outlook described as punchy and a carefully chosen future multiple. Want to see how those levers interact to justify today’s upside gap?
Result: Fair Value of $69 (UNDERVALUED)
Have a read of the narrative in full and understand what's behind the forecasts.
However, concentrated tenant exposure and a heavier reliance on asset sales for funding could quickly pressure cash flows and undermine that seemingly comfortable valuation gap.
Find out about the key risks to this W. P. Carey narrative.
Another Take On Value
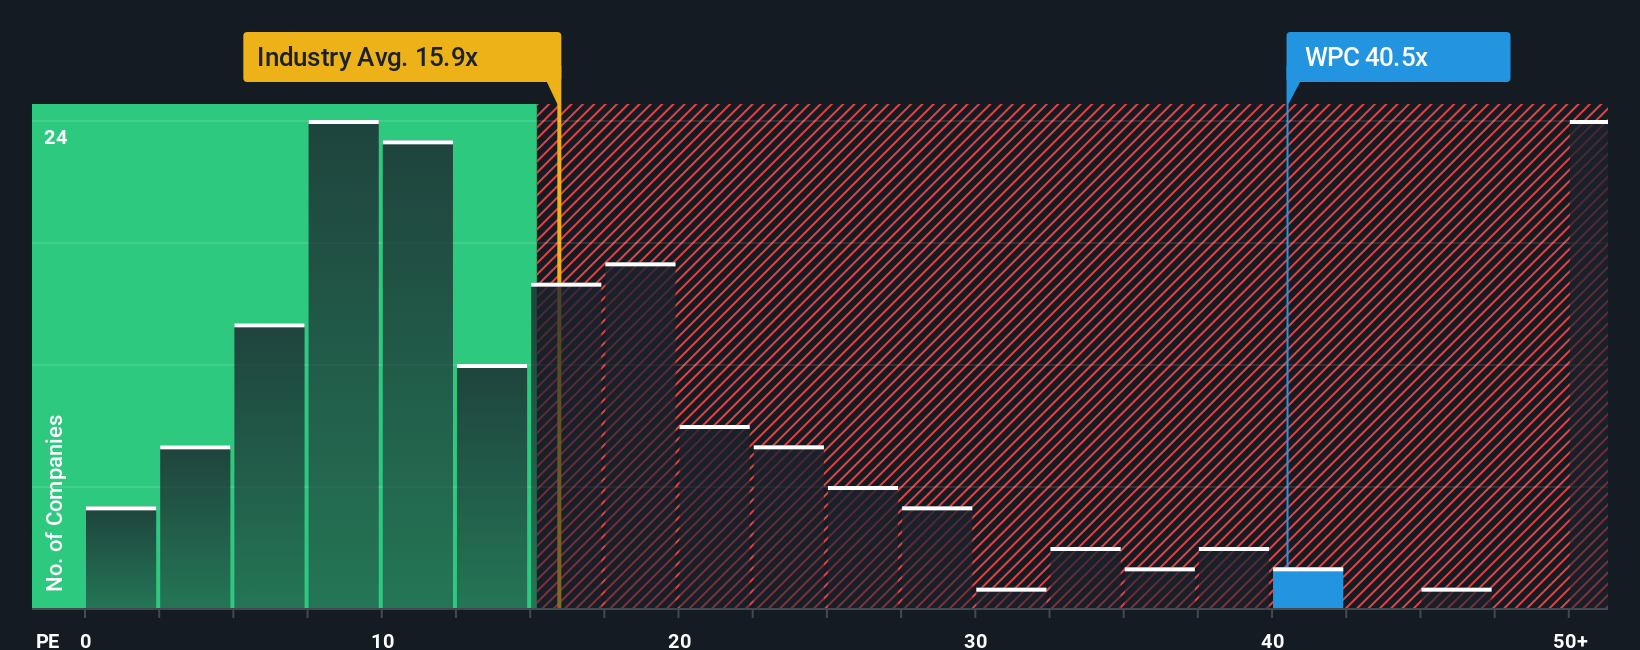
On earnings, the picture flips. W. P. Carey trades at about 39 times earnings, richer than both the US REITs average of 29.2 times and its own 36 times fair ratio. That premium hints at less margin for error if growth or rates move the wrong way, so what exactly is the market paying up for?
See what the numbers say about this price — find out in our valuation breakdown.
Build Your Own W. P. Carey Narrative
If you would rather challenge these assumptions or dig into the numbers yourself, you can build a complete, personalized story for W. P. Carey in minutes: Do it your way.
A great starting point for your W. P. Carey research is our analysis highlighting 2 key rewards and 3 important warning signs that could impact your investment decision.
Ready for more actionable investment ideas?
Do not stop with a single opportunity; use the Simply Wall St Screener to quickly surface fresh ideas that match your strategy before the market wakes up.
- Capture value early by targeting companies trading below their cash flow potential through these 909 undervalued stocks based on cash flows before sentiment shifts and prices recalibrate.
- Capitalize on innovation by seeking growth stories at the forefront of machine learning and automation using these 26 AI penny stocks while they are still gaining institutional attention.
- Secure dependable income by focusing on businesses with attractive, sustainable payouts via these 13 dividend stocks with yields > 3% so your portfolio keeps working even when markets stall.
This article by Simply Wall St is general in nature. We provide commentary based on historical data and analyst forecasts only using an unbiased methodology and our articles are not intended to be financial advice. It does not constitute a recommendation to buy or sell any stock, and does not take account of your objectives, or your financial situation. We aim to bring you long-term focused analysis driven by fundamental data. Note that our analysis may not factor in the latest price-sensitive company announcements or qualitative material. Simply Wall St has no position in any stocks mentioned.
Have feedback on this article? Concerned about the content? Get in touch with us directly. Alternatively, email editorial-team@simplywallst.com