
 Nasdaq
 华尔街日报
华尔街日报Does Crown Holdings Share Price Miss Long Term Cash Flow Growth Potential in 2025?
- Wondering if Crown Holdings at around $101.53 is still a smart buy or if most of the upside has already been priced in? Here is a closer look at what the current share price really implies about its value.
- The stock has climbed 7.8% over the last week, 4.5% over the past month, and is up 25.0% year to date, adding to a 20.2% gain over the last year that has many investors taking a fresh look.
- Some of this momentum reflects renewed interest in packaging names as investors rotate toward companies with more defensive cash flows, along with optimism around ongoing cost efficiency efforts and portfolio optimization at Crown. In addition, sector wide shifts toward sustainable packaging and metal cans have put a spotlight on players like Crown that are positioned to benefit from long term demand trends.
- Despite the run up, Crown scores a 5/6 valuation check, suggesting it still screens as undervalued on most metrics. Next, we will walk through those methods, before finishing with a more intuitive way to think about what the market might be missing.
Approach 1: Crown Holdings Discounted Cash Flow (DCF) Analysis
A Discounted Cash Flow model estimates what a business is worth today by projecting its future cash flows and discounting them back to the present.
For Crown Holdings, the latest twelve month Free Cash Flow sits at about $796 million. Analysts expect this to rise to roughly $1,015 million by 2027, and Simply Wall St then extrapolates this trajectory, with projections reaching around $1,378 million by 2035 under a two stage Free Cash Flow to Equity model.
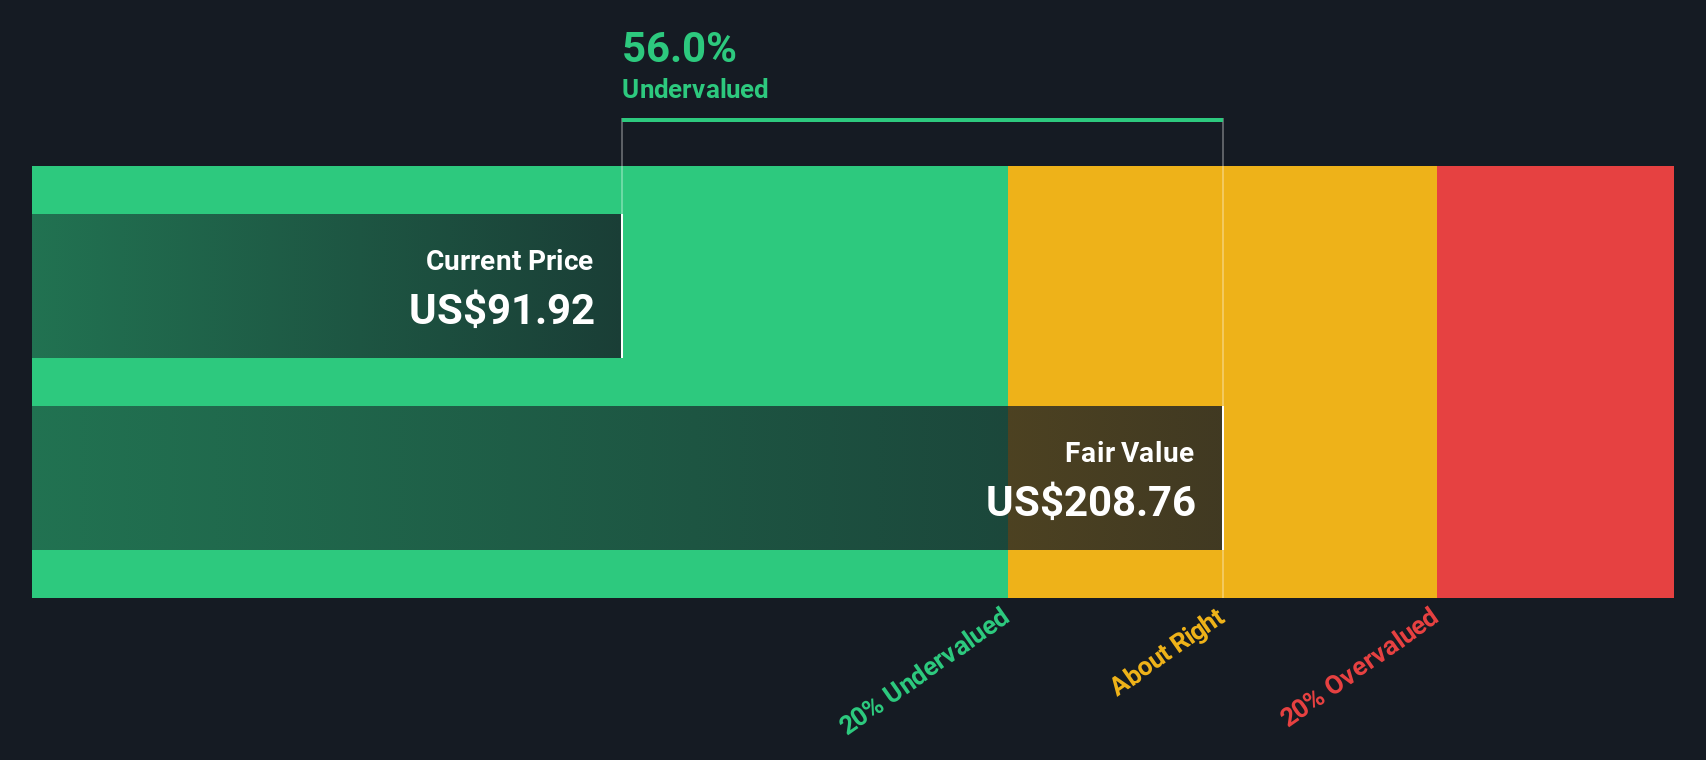
Aggregating and discounting these future cash flows produces an estimated intrinsic value of about $207.19 per share. Compared with the current share price of roughly $101.53, the DCF suggests the stock is trading at a 51.0% discount to its calculated fair value. This indicates that the market may be significantly underpricing Crown’s medium to long term cash generation potential.
Result: UNDERVALUED
Our Discounted Cash Flow (DCF) analysis suggests Crown Holdings is undervalued by 51.0%. Track this in your watchlist or portfolio, or discover 909 more undervalued stocks based on cash flows.
Approach 2: Crown Holdings Price vs Earnings
For profitable, established businesses like Crown Holdings, the price to earnings ratio is a straightforward way to gauge how much investors are willing to pay today for each dollar of current earnings. It links directly to the bottom line that ultimately funds dividends, buybacks and debt reduction, so it is a widely used yardstick for valuation.
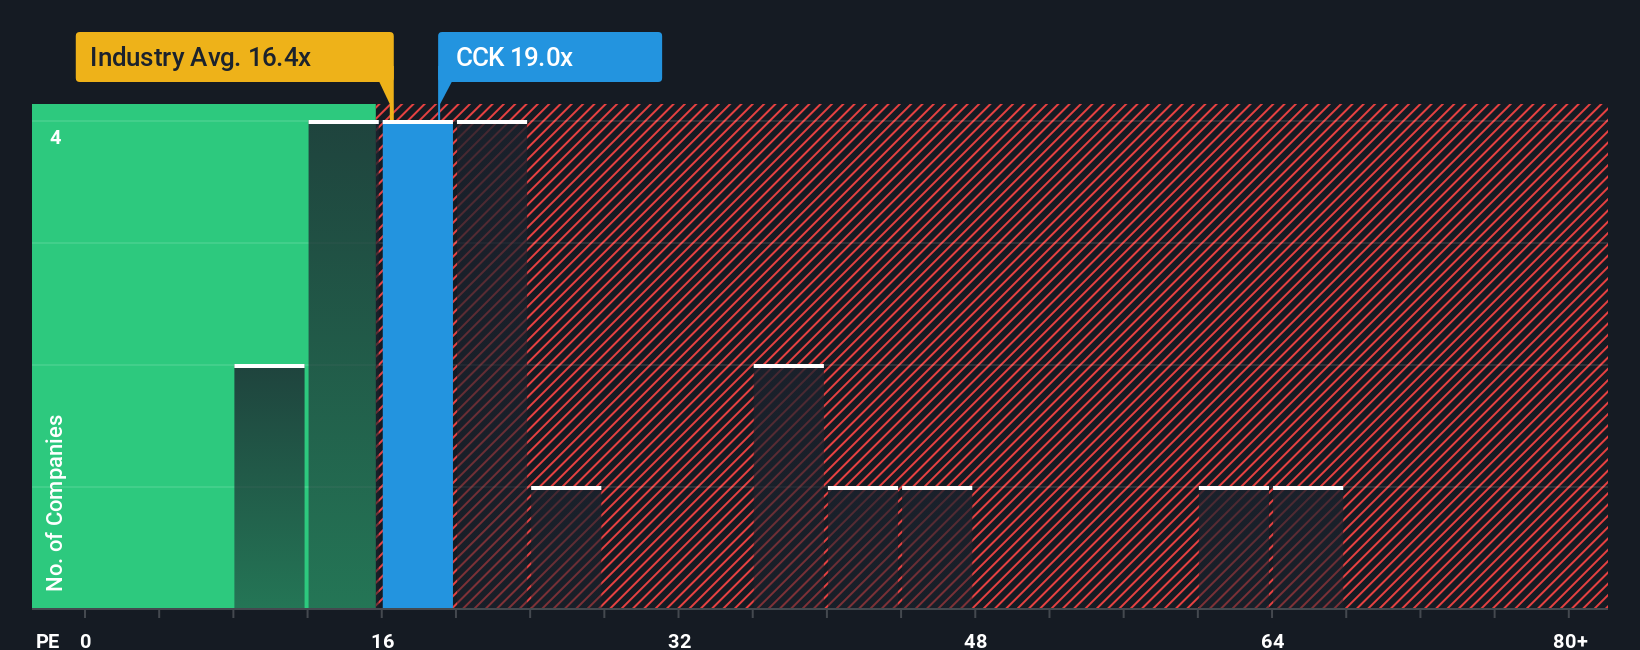
What counts as a normal or fair PE depends on how quickly earnings are expected to grow and how risky those earnings are. Higher growth and more resilient cash flows usually justify a higher multiple, while slower or more volatile earnings typically warrant a lower one. Crown currently trades on a PE of about 12.24x, below the Packaging industry average of roughly 15.57x and far below the broader peer group average of around 62.94x. This points to a cautious market view.
Simply Wall St’s Fair Ratio framework goes a step further by estimating what PE Crown should trade at given its earnings growth outlook, profitability, industry, size and risk profile. For Crown, this Fair Ratio is 17.19x. This implies that, once these fundamentals are accounted for, the stock appears to deserve a higher multiple than it currently commands, and is therefore undervalued on this lens.
Result: UNDERVALUED
PE ratios tell one story, but what if the real opportunity lies elsewhere? Discover 1463 companies where insiders are betting big on explosive growth.
Upgrade Your Decision Making: Choose your Crown Holdings Narrative
Earlier we mentioned that there is an even better way to understand valuation, so let us introduce Narratives, a simple way to connect your view of a company’s story with a concrete forecast and a Fair Value that you can compare to today’s share price.
A Narrative is your own explanation for where Crown’s revenue, earnings and margins are headed, and why, turning bare numbers like growth rates and profit margins into a story about things such as sustainable metal packaging demand, capacity expansions and cost efficiencies.
On Simply Wall St’s Community page, millions of investors use Narratives as an accessible tool that links this story to a full financial forecast and a Fair Value estimate. Narratives then keep that view up to date as new information such as earnings results, news or buyback announcements emerges.
For example, one Crown investor might build a bullish Narrative that sees long term demand for sustainable cans and ongoing buybacks justifying a Fair Value near the top of analyst expectations around $140. A more cautious investor, focused on input cost inflation and geographic risks, may only see Fair Value closer to $110, and Narratives help each of them decide whether the current price is high enough to sell or low enough to buy.
Do you think there's more to the story for Crown Holdings? Head over to our Community to see what others are saying!

This article by Simply Wall St is general in nature. We provide commentary based on historical data and analyst forecasts only using an unbiased methodology and our articles are not intended to be financial advice. It does not constitute a recommendation to buy or sell any stock, and does not take account of your objectives, or your financial situation. We aim to bring you long-term focused analysis driven by fundamental data. Note that our analysis may not factor in the latest price-sensitive company announcements or qualitative material. Simply Wall St has no position in any stocks mentioned.
Have feedback on this article? Concerned about the content? Get in touch with us directly. Alternatively, email editorial-team@simplywallst.com