
 Nasdaq
 华尔街日报
华尔街日报Is StoneCo’s 2025 Rally Just the Beginning After 81% Year to Date Surge?
- If you are wondering whether StoneCo is still a recovery story or already a bargain hiding in plain sight, this breakdown will help you assess whether the current price makes sense.
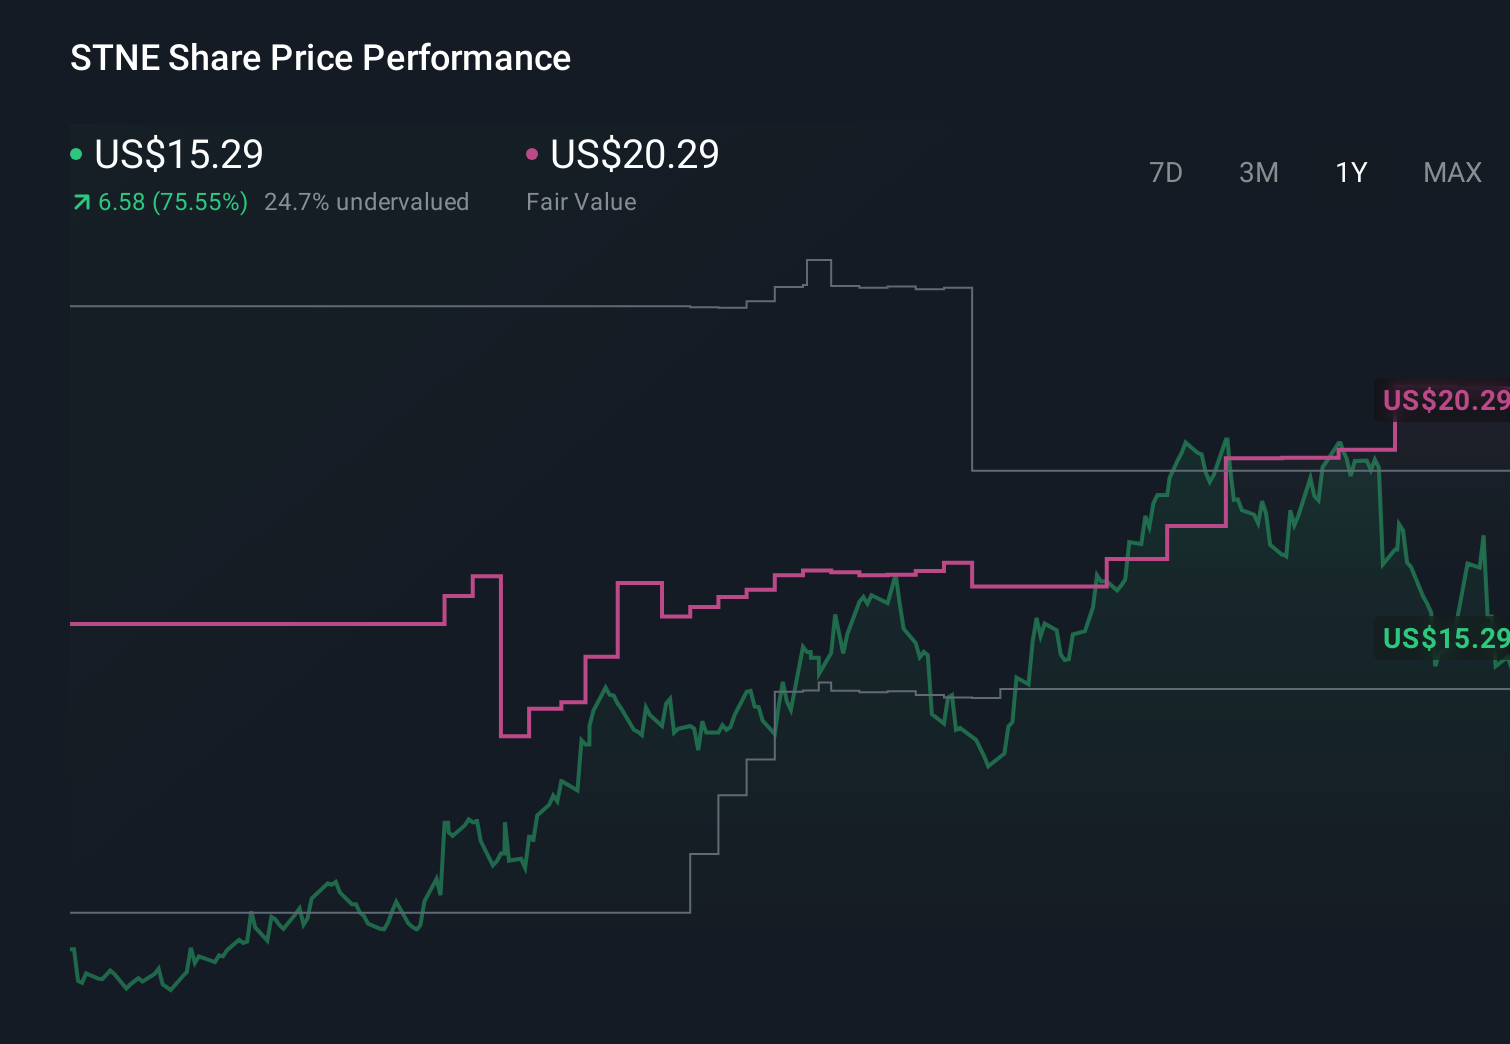
- Despite a choppy near term, with the stock roughly flat over the last week and down about 12.5% in the last month, StoneCo is still up 81.1% year to date and 68.4% over the past year, a sharp swing from its deeply negative 5 year return.
- Recent share price moves have been driven by shifting sentiment around Brazilian fintechs, as investors weigh StoneCo's execution against ongoing competition and regulatory changes in the payments space. At the same time, the market has been reassessing growth oriented financial technology names more broadly, which has added extra volatility to StoneCo's valuation.
- Even after this rebound, StoneCo scores a 6/6 valuation check, suggesting it screens as undervalued across all the measures used here. In the sections that follow, this article will walk through those methods, then finish by exploring an approach to tie them together into a single valuation narrative.
Approach 1: StoneCo Excess Returns Analysis
The Excess Returns model looks at how much value StoneCo can create above the minimum return that equity investors require, based on its profitability and expected growth in book value per share.
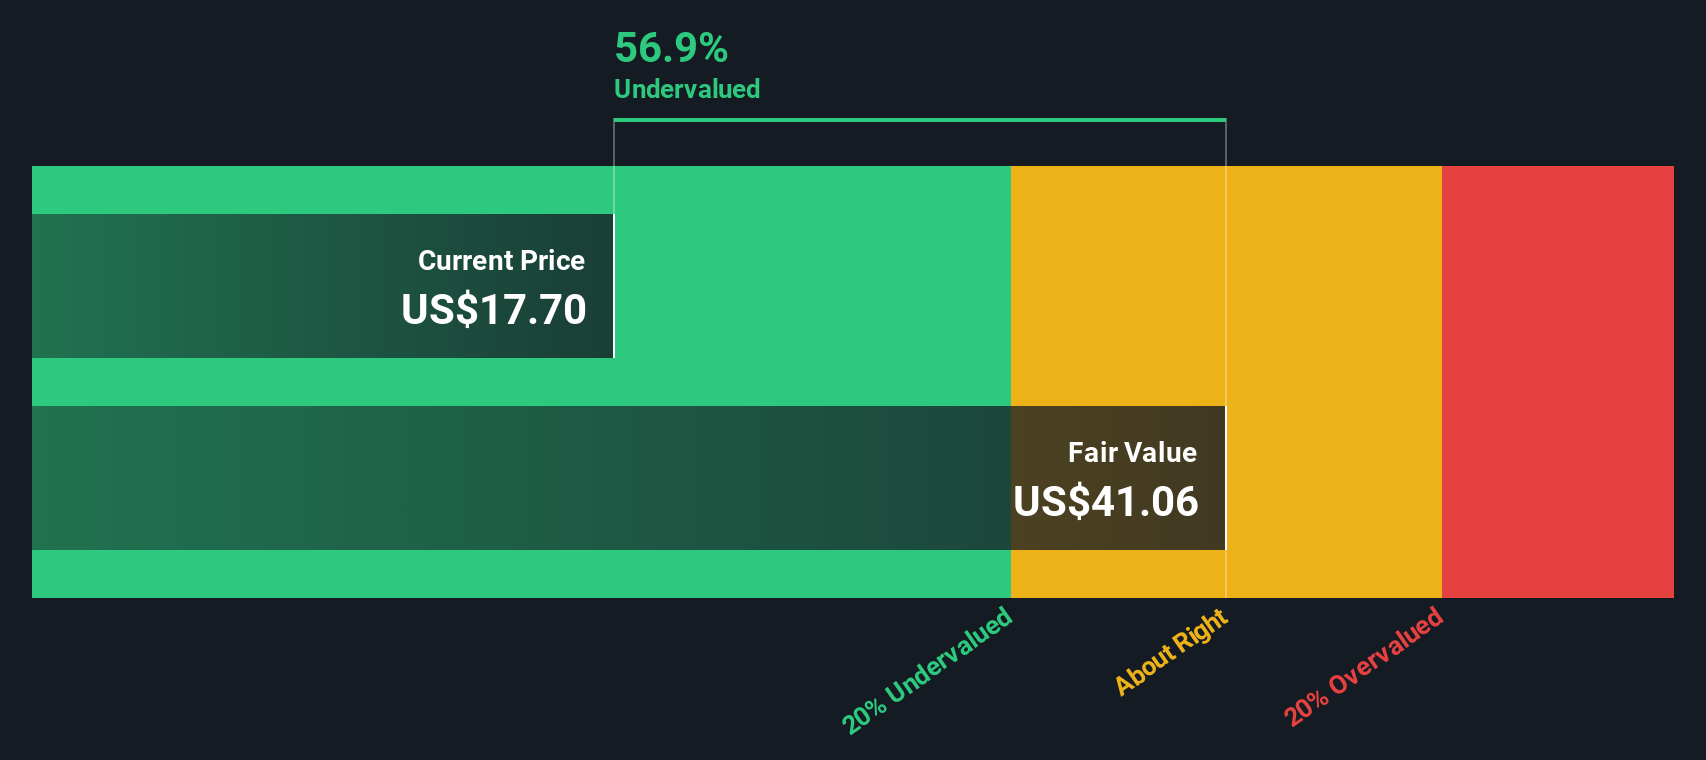
For StoneCo, the starting point is a Book Value of $44.78 per share and a Stable EPS of $12.25 per share, derived from weighted future Return on Equity estimates from 7 analysts. This implies an Average Return on Equity of 25.03%, which is above the Cost of Equity of $4.32 per share. The gap between what the business earns and what investors require translates into an Excess Return of $7.93 per share.
Analysts also expect StoneCo’s Stable Book Value to rise toward $48.93 per share, based on forecasts from 5 analysts, which supports a view that these excess returns could compound over time under the model’s assumptions. Feeding these inputs into the Excess Returns valuation framework yields an intrinsic value of roughly $35 per share, which is about 58.0% higher than its current market price based on this approach.
Result: UNDERVALUED (model-based)
Our Excess Returns analysis suggests StoneCo is undervalued by 58.0%. Track this in your watchlist or portfolio, or discover 914 more undervalued stocks based on cash flows.
Approach 2: StoneCo Price vs Sales
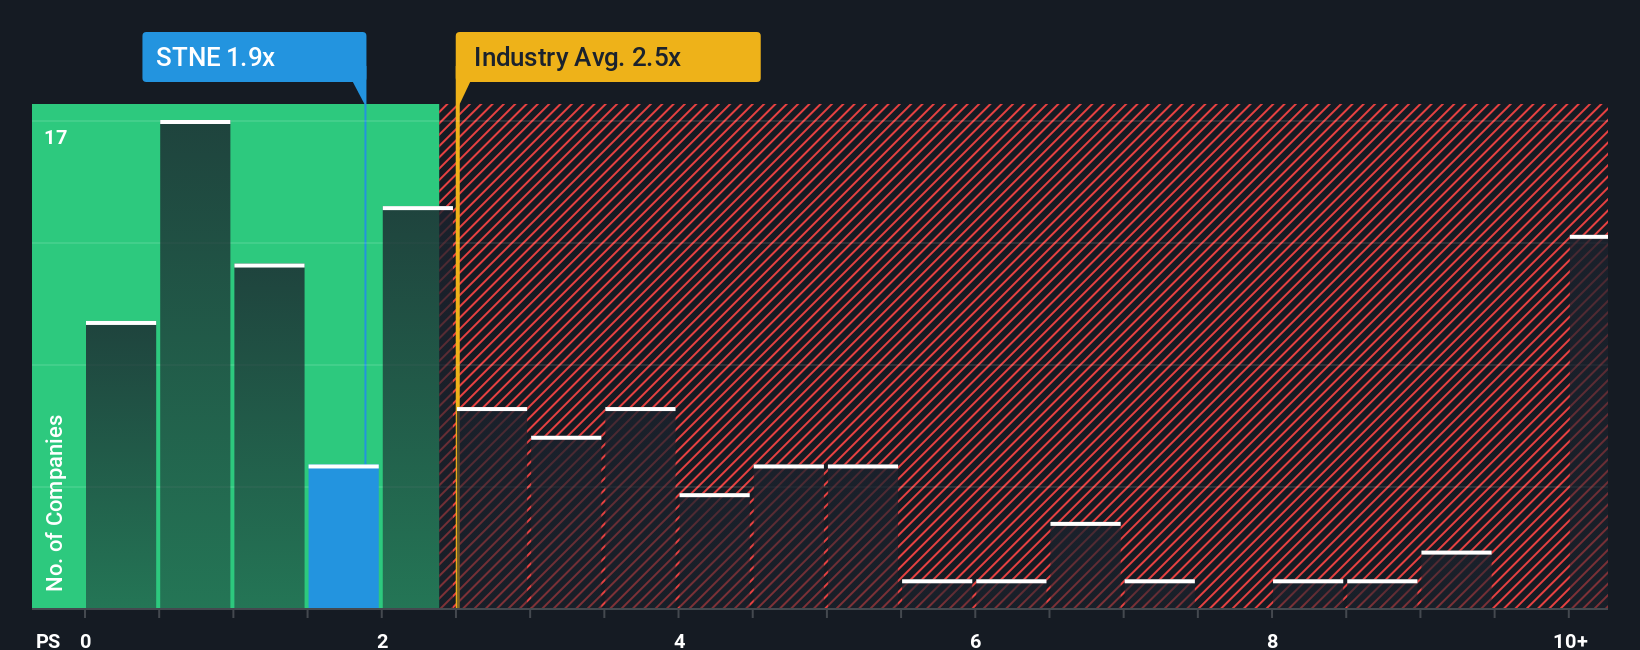
For a profitable, scaling fintech like StoneCo, the price to sales multiple is a useful way to judge valuation because it links the share price directly to the revenue base that future earnings can be built from. As investors weigh how fast that revenue can grow and how stable margins are, they tend to pay higher or lower sales multiples to reflect growth expectations and risk.
StoneCo currently trades on a price to sales ratio of around 1.48x, which sits below both the Diversified Financial industry average of about 2.54x and the peer group average of roughly 2.33x. Simply Wall St’s Fair Ratio for StoneCo is 2.69x, a proprietary estimate of the multiple the stock could justify once you factor in its specific growth profile, profitability, risk, size, and industry positioning. This makes it more tailored than a simple comparison with peers or sector averages, which can blur important differences between business models.
Comparing the current 1.48x to the 2.69x Fair Ratio suggests that, on a sales basis, the market is still discounting StoneCo’s fundamentals and growth prospects by a wide margin.
Result: UNDERVALUED
PS ratios tell one story, but what if the real opportunity lies elsewhere? Discover 1461 companies where insiders are betting big on explosive growth.
Upgrade Your Decision Making: Choose your StoneCo Narrative
Earlier we mentioned that there is an even better way to understand valuation, so let us introduce Narratives, which are simply your story about a company linked directly to a financial forecast and a fair value, allowing you to say, for example, that StoneCo deserves a higher fair value closer to $20.29 because you expect revenue, margins and buybacks to play out like the more optimistic community forecast, or a lower value nearer $14.37 if you think growth slows and risks bite harder, with Simply Wall St’s Community page giving you an easy visual way to set these assumptions, compare your Narrative fair value to today’s price to inform whether to buy, hold or sell, and then watch that Narrative update dynamically as new earnings, news and analyst revisions arrive so your investment decision stays anchored to both the story you believe and the latest numbers.
Do you think there's more to the story for StoneCo? Head over to our Community to see what others are saying!
This article by Simply Wall St is general in nature. We provide commentary based on historical data and analyst forecasts only using an unbiased methodology and our articles are not intended to be financial advice. It does not constitute a recommendation to buy or sell any stock, and does not take account of your objectives, or your financial situation. We aim to bring you long-term focused analysis driven by fundamental data. Note that our analysis may not factor in the latest price-sensitive company announcements or qualitative material. Simply Wall St has no position in any stocks mentioned.
Have feedback on this article? Concerned about the content? Get in touch with us directly. Alternatively, email editorial-team@simplywallst.com