
 Nasdaq
 华尔街日报
华尔街日报Is Tesla’s Soaring 2025 Share Price Still Justified Amid AI and EV Growth Hopes?
- If you are wondering whether Tesla at around $489 a share is still a buy or already priced for perfection, you are not alone. This piece is designed to cut through the noise for you.
- Over the last week Tesla has climbed 10.0%, extending a 21.2% gain over the past month and a 29.2% rise year to date, even though the 1 year return sits at just 2.1% after a wild few years that saw the stock surge 255.5% over 3 years and 129.5% over 5 years.
- Some of that recent momentum has been tied to ongoing headlines around Tesla's aggressive push into AI driven autonomous driving, expanding energy storage projects, and regulatory discussions about EV incentives that keep the story firmly in the spotlight. At the same time, debates over competition from legacy automakers and new EV entrants continue to shape how investors think about the durability of Tesla's growth.
- Despite all that excitement, Tesla currently scores just 0/6 on our valuation checks, suggesting the market may already be baking in a lot of optimism. Next we will unpack how different valuation methods line up on Tesla and hint at an even better way to think about what the stock is really worth by the end of this article.
Tesla scores just 0/6 on our valuation checks. See what other red flags we found in the full valuation breakdown.
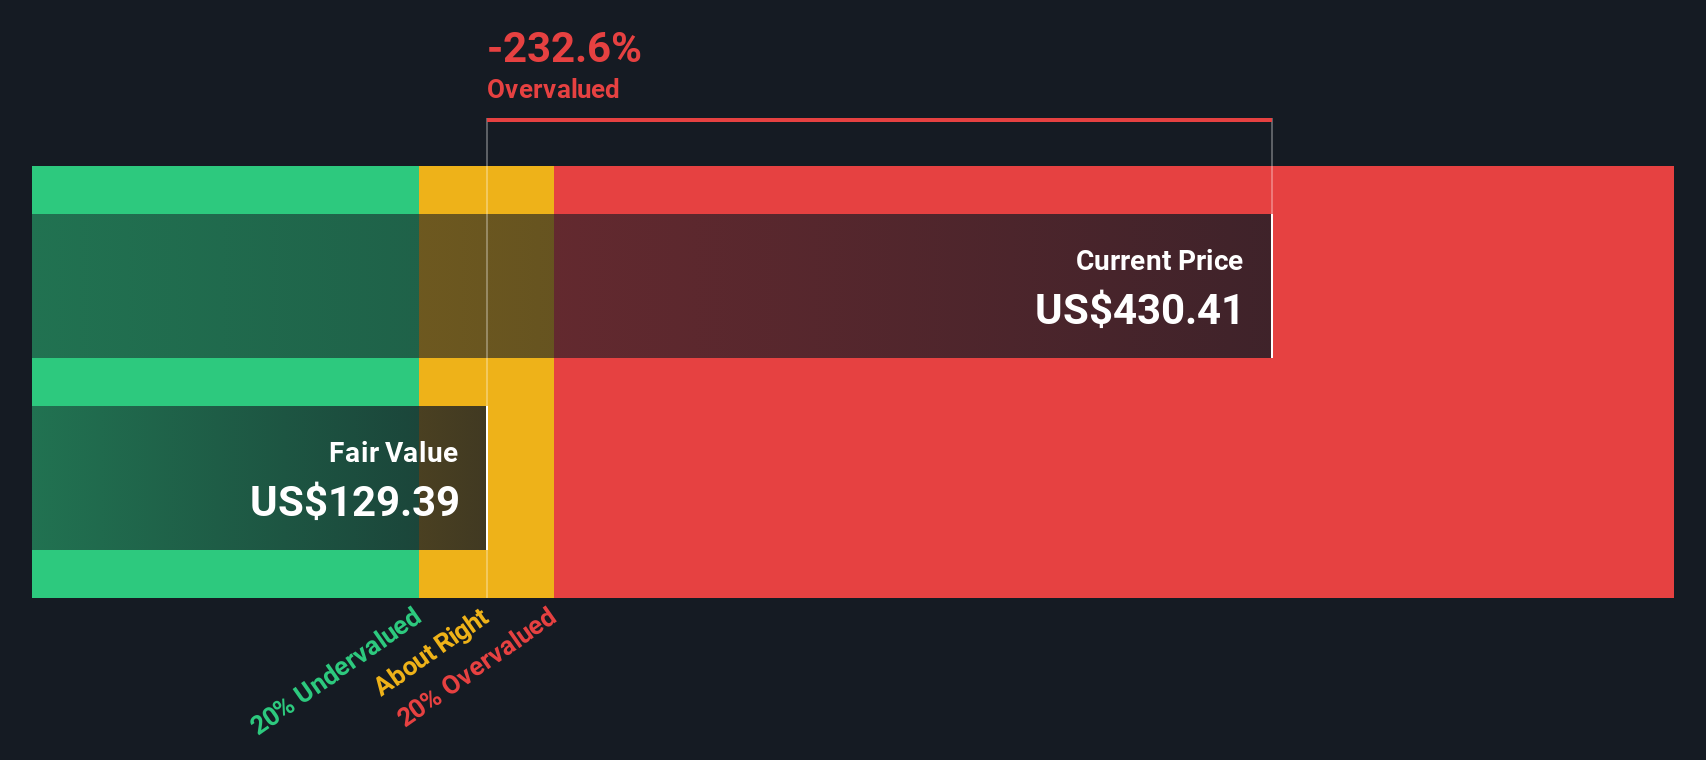
Approach 1: Tesla Discounted Cash Flow (DCF) Analysis
A Discounted Cash Flow, or DCF, model estimates what a business is worth today by projecting the cash it can generate in the future and discounting those cash flows back to the present.
For Tesla, the model starts with last twelve months Free Cash Flow of about $6.4 billion and then uses analyst forecasts and longer term assumptions to map out how that figure could grow. By 2029, annual Free Cash Flow is projected to reach roughly $20.9 billion, with further growth extrapolated by Simply Wall St through 2035 using a 2 Stage Free Cash Flow to Equity framework.
When all those future cash flows in dollars are discounted back to today, the DCF model arrives at an intrinsic value of about $137.66 per share. With the current share price around $489, the DCF implies Tesla is roughly 255.9% overvalued on this cash flow based view.
Result: OVERVALUED
Our Discounted Cash Flow (DCF) analysis suggests Tesla may be overvalued by 255.9%. Discover 915 undervalued stocks or create your own screener to find better value opportunities.
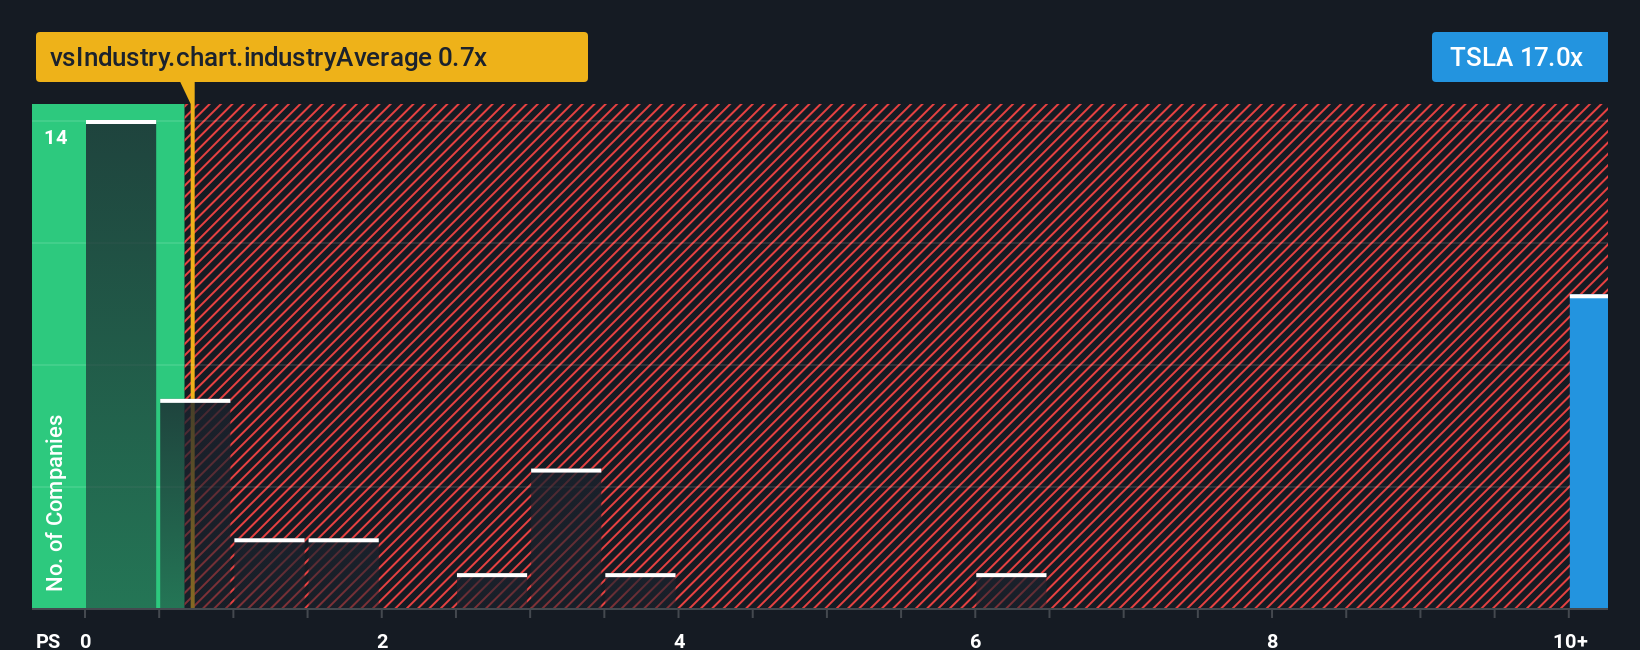
Approach 2: Tesla Price vs Sales
For profitable growth companies like Tesla, the price to sales ratio is a useful way to gauge how much investors are willing to pay for each dollar of revenue, especially when earnings can be volatile due to heavy investment cycles. In general, faster growth and lower risk justify higher multiples, while slower growth or higher uncertainty tend to pull a normal or fair multiple closer to the industry average.
Tesla currently trades on a price to sales ratio of about 17.04x, compared with an Auto industry average of roughly 0.72x and a peer group average of around 1.45x. This highlights how much growth and execution investors are pricing in. Simply Wall St also calculates a Fair Ratio of 2.87x, a proprietary estimate of what Tesla’s price to sales multiple should be after factoring in its growth outlook, profitability, size, industry and specific risks. This Fair Ratio is more informative than a simple peer or industry comparison because it adjusts for Tesla’s unique characteristics rather than assuming all automakers deserve similar valuations.
With Tesla’s actual price to sales multiple far above the 2.87x Fair Ratio, the stock looks richly valued on this metric.
Result: OVERVALUED
PS ratios tell one story, but what if the real opportunity lies elsewhere? Discover 1460 companies where insiders are betting big on explosive growth.
Upgrade Your Decision Making: Choose your Tesla Narrative
Earlier we mentioned that there is an even better way to understand valuation, so let us introduce you to Narratives, an easy framework on Simply Wall St’s Community page that lets you write the story behind your numbers by connecting your view of a company to a concrete forecast and a Fair Value you can compare to today’s price to decide whether to buy, hold or sell. That Fair Value updates dynamically as new news, earnings or guidance arrive. For Tesla, one investor might argue it is mainly a cyclical car maker facing intense Chinese competition and worth only about $67 per share, while another sees it evolving into a multi trillion dollar AI, energy and robotics platform that could justify a value closer to $2,700. Narratives helps both investors turn those very different stories into explicit assumptions for future revenue, margins and P E multiples that can be tracked, tested and refined over time rather than staying vague opinions.
For Tesla however we will make it really easy for you with previews of two leading Tesla Narratives:
Fair value: $2,707.91 per share
Implied undervaluation vs current price: -81.9%
Forecast revenue growth: 77%
- Views Tesla as a diversified technology platform spanning AI, robotics, energy storage, software and autos, not just an EV maker.
- Projects 2030 revenue of around $1.94 trillion with net profit of $534 billion, implying a 27.5% profit margin.
- Discounts 2030 valuation back to today to derive a fair value in the $2,100 to $4,200 range per share, framing current levels as massively undervalued if Tesla delivers on its vision.
Fair value: $332.71 per share
Implied overvaluation vs current price: 47.2%
Forecast revenue growth: 30%
- Assumes Tesla still grows solidly through new products like Cybertruck, Model 2, Semi, Optimus and FSD, but with more measured revenue and earnings outcomes.
- Builds in meaningful execution, regulatory, competitive and supply chain risks that could cap margins and slow scaling of high profile initiatives like robotaxis and humanoid robots.
- Applies more conventional profit margins and future P E multiples, arriving at a fair value well below today’s price and framing Tesla as overvalued relative to realistic execution risk.
Do you think there's more to the story for Tesla? Head over to our Community to see what others are saying!
This article by Simply Wall St is general in nature. We provide commentary based on historical data and analyst forecasts only using an unbiased methodology and our articles are not intended to be financial advice. It does not constitute a recommendation to buy or sell any stock, and does not take account of your objectives, or your financial situation. We aim to bring you long-term focused analysis driven by fundamental data. Note that our analysis may not factor in the latest price-sensitive company announcements or qualitative material. Simply Wall St has no position in any stocks mentioned.
Have feedback on this article? Concerned about the content? Get in touch with us directly. Alternatively, email editorial-team@simplywallst.com