
 Nasdaq
 华尔街日报
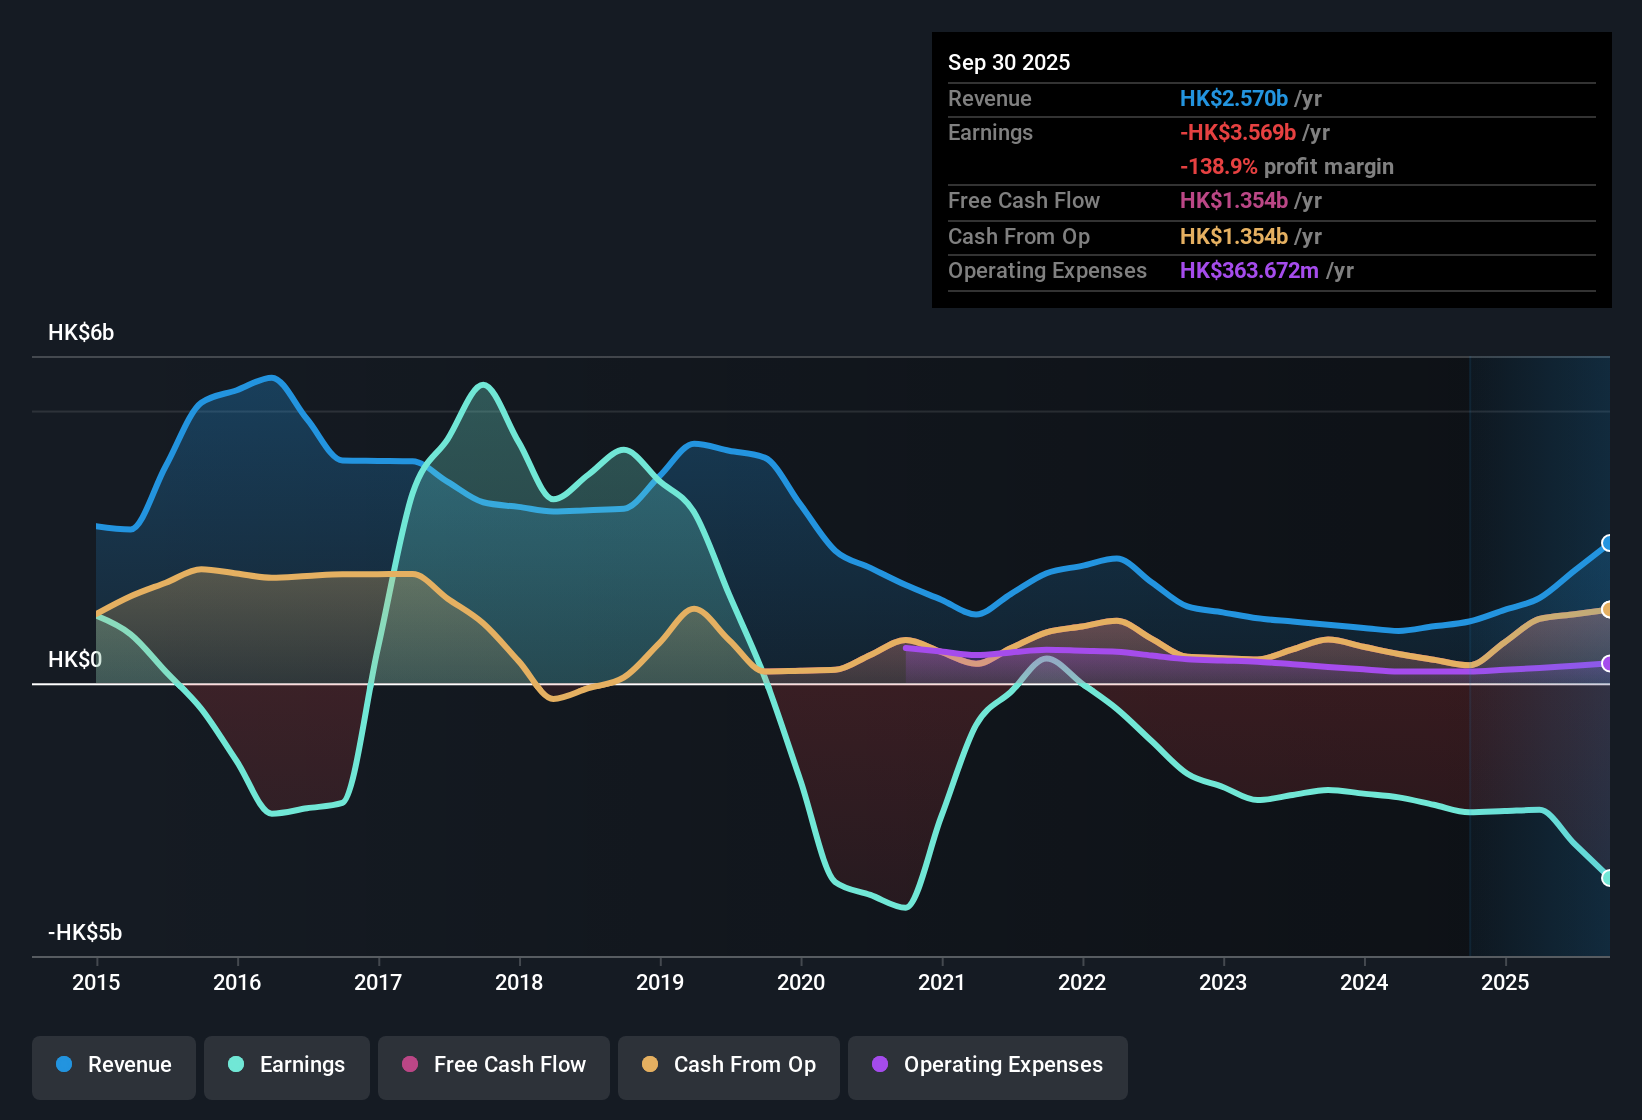
华尔街日报Emperor International (SEHK:163) Deepening HK$3.7b TTM Loss Reinforces Bearish Profitability Narratives
Emperor International Holdings (SEHK:163) has posted another tough set of H1 2026 numbers, with total revenue of about HK$1.0 billion and a basic EPS loss of roughly HK$0.25, underscoring that the business is still running in the red. Looking back, revenue has hovered in the HK$0.6 billion range in H1 2025 and H2 2024 while EPS stayed negative between HK$0.25 and HK$0.36, and over the last 12 months the company has remained unprofitable as losses have been compounding at an 18.1% annualised pace over five years. This has left investors focused on whether margins can stabilise from here.
See our full analysis for Emperor International Holdings.With the headline numbers on the table, the real question now is how this worsening loss profile lines up with the most widely held stories about the stock, and which parts of the prevailing narratives those results start to confirm or contradict.
Curious how numbers become stories that shape markets? Explore Community Narratives
Trailing Losses Hit HK$3.7 Billion
- Over the last 12 months, net income excluding extra items came in at about HK$3,666.9 million of losses, compared with losses of HK$1,376.3 million in H2 2025 and HK$1,319.2 million in H2 2024, highlighting how large the current loss run rate is versus recent half year periods.
- Bears focus on this deterioration, arguing the roughly 18.1% annual loss growth over five years shows a business that has not yet contained its downside,
- That five year trend of losses increasing around 18.1% per year lines up with the latest 12 month loss figure being significantly larger than any of the individual recent halves.
- This pattern supports a bearish view that the trailing H1 2026 profile is still about absorbing large losses rather than showing a clear narrowing against history.
Revenue Tops HK$2.7 Billion, But Profit Still Missing
- On a trailing 12 month basis, total revenue reached about HK$2,696.5 million, well above any single half year reading such as the HK$1,001.3 million posted in H2 2025, yet the business still recorded those HK$3,666.9 million in net losses over the same period.
- What stands out for a cautious, bearish interpretation is that higher revenue has not translated into positive earnings,
- Across H1 2025 to H2 2025, revenue moved between roughly HK$559.2 million and HK$1,001.3 million, but net income excluding extra items stayed deeply negative in a range from about HK$944.6 million to HK$1,376.3 million of losses.
- That combination of multi billion dollar revenue over 12 months and persistent losses challenges any bullish idea that scale alone is enough to tip the business back into profitability soon.
DCF Fair Value Towering Above HK$0.20 Price
- The shares trade around HK$0.20 compared with a DCF fair value of about HK$4.24 and a price to sales ratio of roughly 0.4 times versus a Hong Kong real estate industry average of 0.7 times and a peer average of 4.8 times, leaving a sizable valuation gap on each metric.
- From a more bullish angle, investors who focus on deep value see this spread as the main opportunity,
- The roughly 95.2% discount of the share price to the DCF fair value suggests the market price is reflecting the weak five year earnings trend much more than the modelled long term cash flows.
- At the same time, trading at 0.4 times sales relative to the 0.7 times industry figure and 4.8 times peer average reinforces the idea that any stabilisation in losses could have an outsized impact on the share price.
Next Steps
Don't just look at this quarter; the real story is in the long-term trend. We've done an in-depth analysis on Emperor International Holdings's growth and its valuation to see if today's price is a bargain. Add the company to your watchlist or portfolio now so you don't miss the next big move.
Explore Alternatives
Emperor International Holdings is struggling with deep, widening losses despite sizable revenue and trades cheaply, partly because the market doubts a timely path back to profitability.
If you want businesses already proving they can grow without this kind of persistent red ink, use our stable growth stocks screener (2085 results) to quickly focus on companies delivering steadier revenue and earnings trajectories.
This article by Simply Wall St is general in nature. We provide commentary based on historical data and analyst forecasts only using an unbiased methodology and our articles are not intended to be financial advice. It does not constitute a recommendation to buy or sell any stock, and does not take account of your objectives, or your financial situation. We aim to bring you long-term focused analysis driven by fundamental data. Note that our analysis may not factor in the latest price-sensitive company announcements or qualitative material. Simply Wall St has no position in any stocks mentioned.
Have feedback on this article? Concerned about the content? Get in touch with us directly. Alternatively, email editorial-team@simplywallst.com