
 Nasdaq
 华尔街日报
华尔街日报Has Eaton’s Surge in Electrification and Data Center Demand Gone Too Far in 2025?
- If you are wondering whether Eaton is still worth buying after its big run over the last few years, you are not alone. This article is going to dig into what the current share price really implies.
- Despite long term gains of 120.9% over 3 years and 207.9% over 5 years, the stock has cooled recently, slipping 3.5% over the last week and 6.4% over the last month, and leaving year to date returns slightly negative at 0.6% and about 3.7% lower than a year ago.
- Those moves come against a backdrop of steady interest in electrification, power management, and grid modernization, where Eaton has been a recurring name in discussions around infrastructure spending and industrial demand. Recent commentary has highlighted how policy support for energy efficiency and data center growth could be long term tailwinds. That helps explain why investors are quick to reassess the stock whenever the price pulls back.
- On our framework Eaton currently scores a 3 out of 6 valuation checks, suggesting it looks undervalued on some measures but not across the board. Next we will walk through those different approaches, before closing with a more holistic way to think about what the market is really pricing in.
Find out why Eaton's -3.7% return over the last year is lagging behind its peers.
Approach 1: Eaton Discounted Cash Flow (DCF) Analysis
A Discounted Cash Flow model takes estimates of the cash a company will generate in the future, then discounts those cash flows back to a single value today. This gives an estimate of what the business might be worth right now, based purely on projected cash generation.
For Eaton, the latest twelve month free cash flow is about $3.3 billion. Analysts and internal estimates see this rising over time, with free cash flow projected to reach roughly $4.9 billion to $6.2 billion a year across the next decade, before growth steadies. These projections combine external analyst forecasts for the next few years, and then Simply Wall St extrapolations further out to 2035.
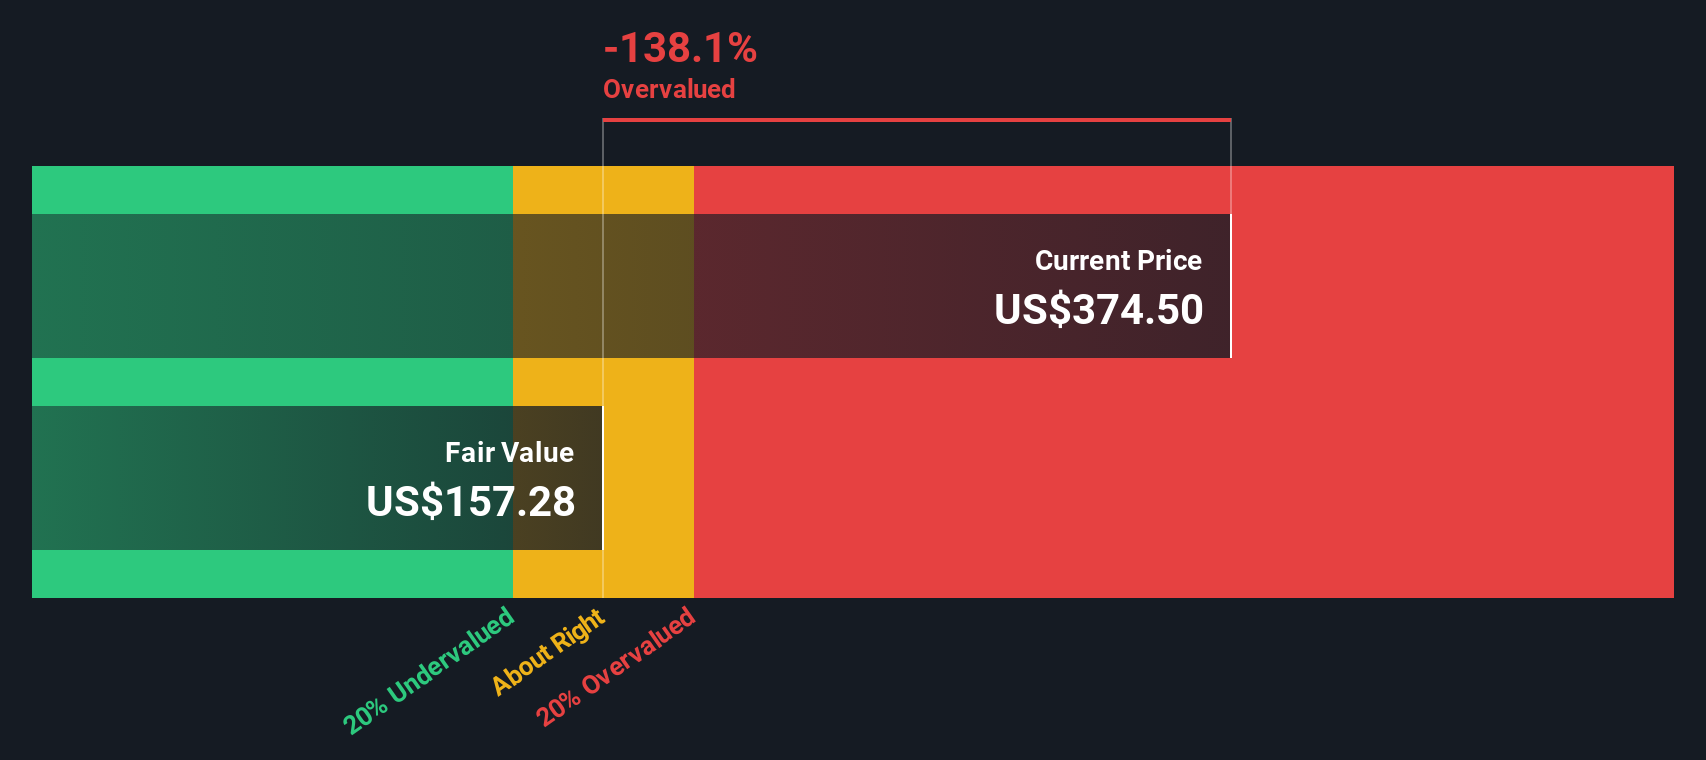
When all those future cash flows are discounted back using a 2 Stage Free Cash Flow to Equity model, the implied intrinsic value comes out at about $155.91 per share. Compared with the current share price, that points to the stock trading roughly 111.6% above the DCF estimate, which indicates it appears significantly overvalued on this measure alone.
Result: OVERVALUED
Our Discounted Cash Flow (DCF) analysis suggests Eaton may be overvalued by 111.6%. Discover 915 undervalued stocks or create your own screener to find better value opportunities.
Approach 2: Eaton Price vs Earnings
For profitable companies like Eaton, the price to earnings ratio is a useful way to gauge valuation because it directly compares what investors are paying with what the business is currently earning. In general, faster growth and lower risk justify a higher PE ratio, while slower growth or higher uncertainty call for a lower, more conservative multiple.
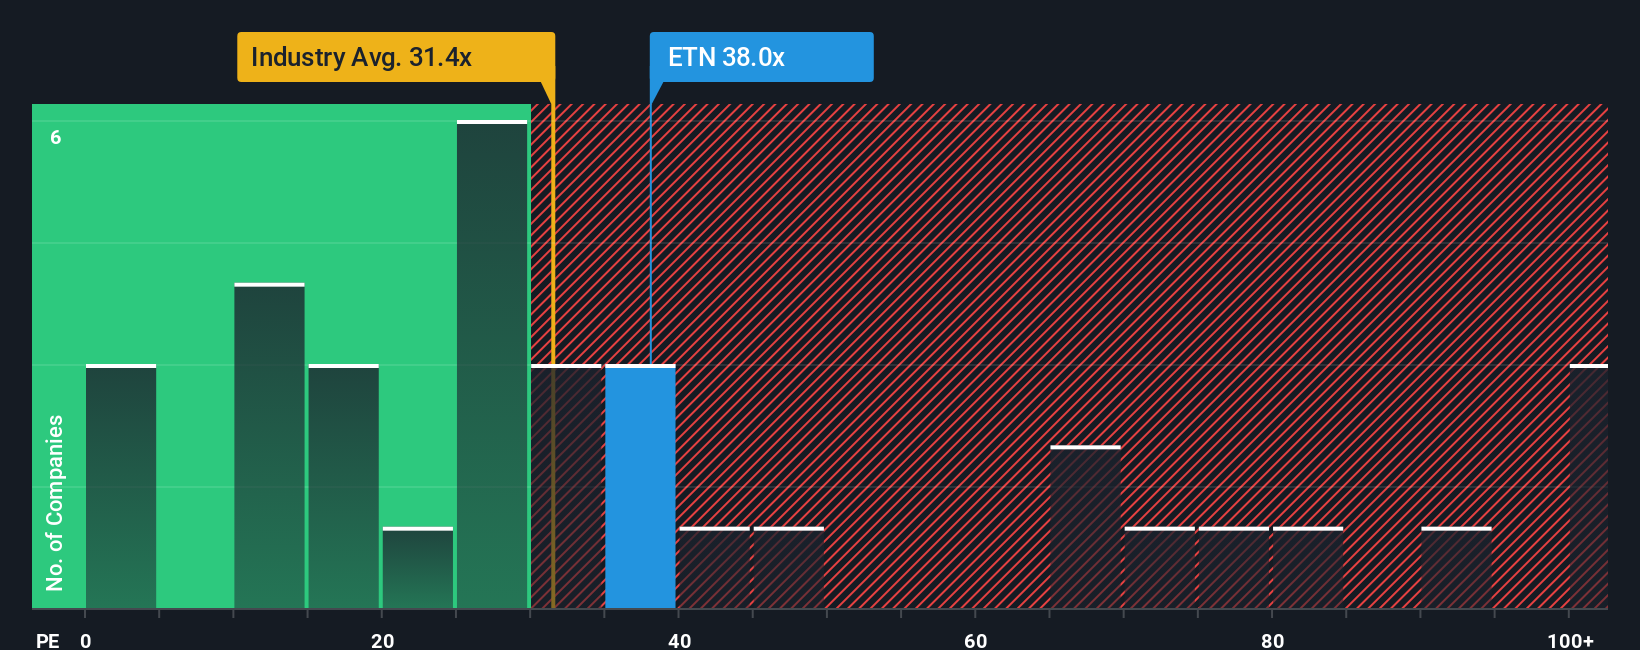
Eaton currently trades on about 32.64x earnings. That is slightly above the wider Electrical industry average of roughly 31.62x, but below the peer group average of about 43.99x, which includes some higher growth names. To refine this comparison, Simply Wall St calculates a proprietary Fair Ratio for each company. This estimates the PE multiple that would be reasonable given its specific earnings growth outlook, industry, profit margins, market value, and risk profile.
Because the Fair Ratio incorporates these company specific factors, it offers a more tailored benchmark than a simple industry or peer comparison. For Eaton, the Fair Ratio is 37.89x, noticeably higher than its current 32.64x multiple. This implies the market is not fully pricing in its fundamentals on this metric.
Result: UNDERVALUED
PE ratios tell one story, but what if the real opportunity lies elsewhere? Discover 1460 companies where insiders are betting big on explosive growth.
Upgrade Your Decision Making: Choose your Eaton Narrative
Earlier we mentioned that there is an even better way to understand valuation, so let's introduce you to Narratives, a simple way to attach your story about a company to the numbers behind its fair value, including your assumptions for future revenue, earnings and margins.
A Narrative links three pieces together: the business story you believe, the financial forecast that flows from that story, and the fair value that those cash flows justify, so you can see clearly whether your view supports buying, holding or selling today.
On Simply Wall St, Narratives live in the Community page and are used by millions of investors, giving you an easy, accessible tool to compare your assumptions with others and to see how different stories lead to different fair values versus the current price.
Because Narratives are updated dynamically when new information such as earnings, guidance or major news is released, your forecast and fair value stay live rather than frozen in time, helping you adjust your buy or sell decisions as the facts change.
For Eaton, for example, one investor might build a bullish Narrative that justifies a fair value near $440 based on robust data center demand, while a more cautious investor could land closer to $288 if they are more concerned about execution risks and cyclicality.
Do you think there's more to the story for Eaton? Head over to our Community to see what others are saying!
This article by Simply Wall St is general in nature. We provide commentary based on historical data and analyst forecasts only using an unbiased methodology and our articles are not intended to be financial advice. It does not constitute a recommendation to buy or sell any stock, and does not take account of your objectives, or your financial situation. We aim to bring you long-term focused analysis driven by fundamental data. Note that our analysis may not factor in the latest price-sensitive company announcements or qualitative material. Simply Wall St has no position in any stocks mentioned.
Have feedback on this article? Concerned about the content? Get in touch with us directly. Alternatively, email editorial-team@simplywallst.com