
 Nasdaq
 华尔街日报
华尔街日报Assessing Snowflake’s Rich Valuation After Strong 2025 Rally and AI Expansion Plans
- Many investors are wondering whether Snowflake is still worth buying at today’s price, or if most of the upside is already baked in. That is exactly what we are going to unpack.
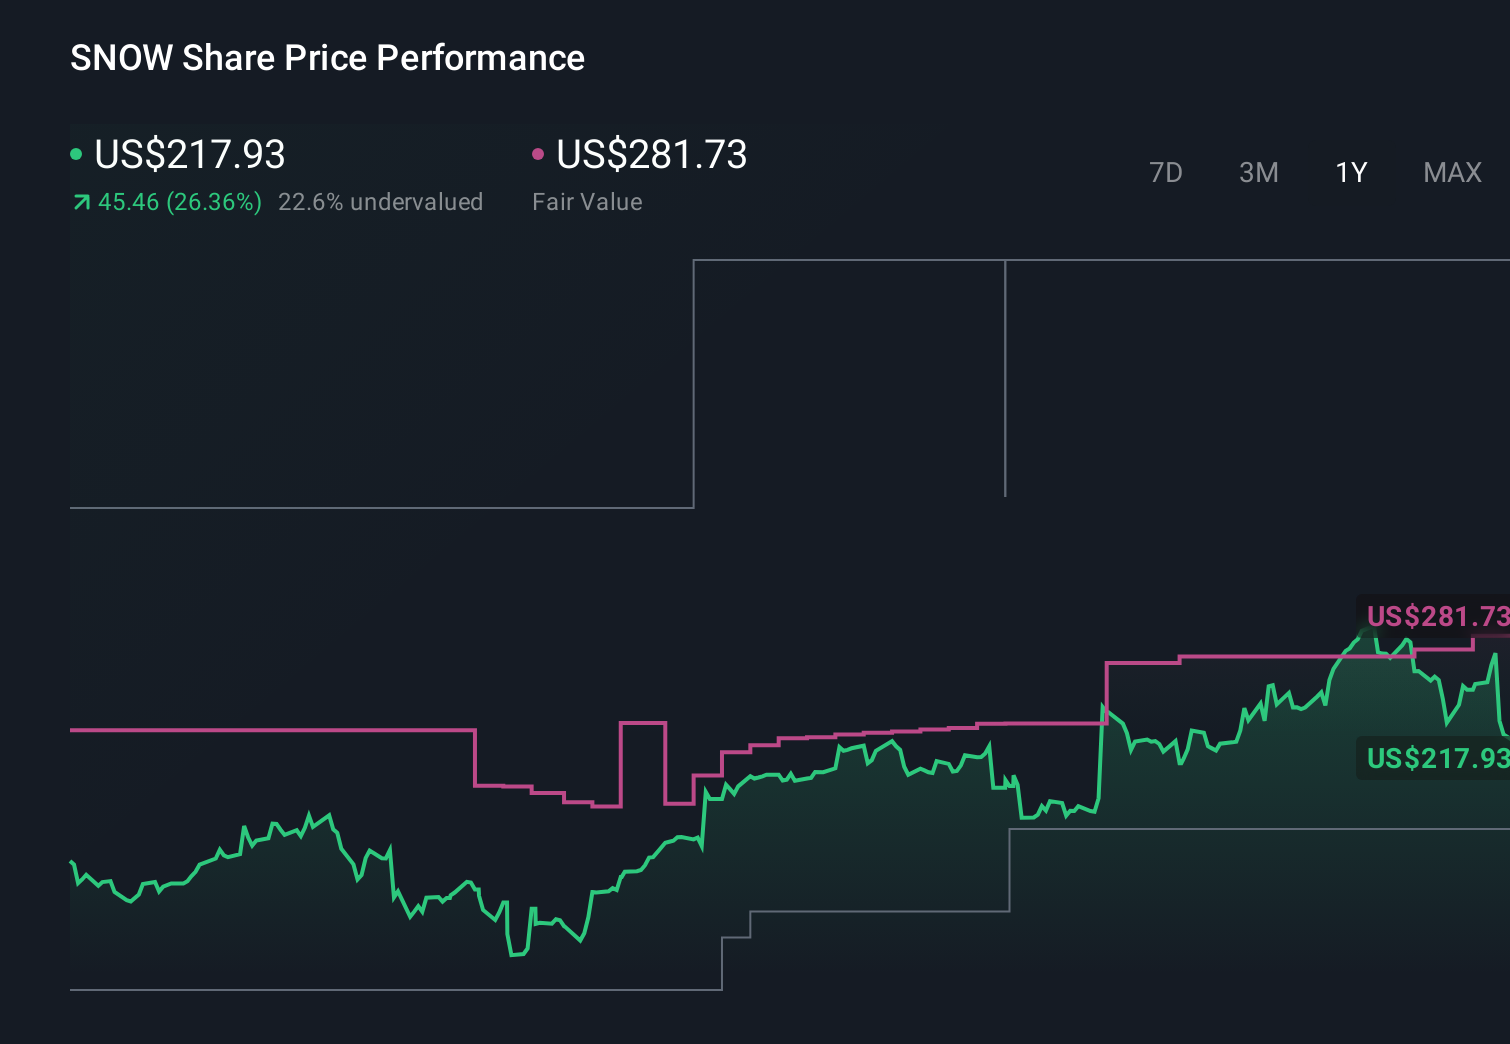
- Despite a choppy few weeks, with the stock down 0.9% over 7 days and 14.2% over 30 days, it is still up 40.1% year to date and 29.1% over the last year. This reminds investors that volatility has come alongside strong multi year gains.
- Recent headlines have focused on Snowflake’s continued push to position itself at the center of the data and AI ecosystem, from expanding its native application and marketplace offerings to deepening partnerships with major cloud providers and analytics platforms. These developments help explain why the market has been willing to look past short term swings and keep pricing in substantial long term growth.
- On our valuation checks, Snowflake only scores 1 out of 6. This might sound harsh until you see how different methods, from DCFs to multiples, each tell a slightly different story. We will finish by looking at an even better way to make sense of that valuation narrative.
Snowflake scores just 1/6 on our valuation checks. See what other red flags we found in the full valuation breakdown.
Approach 1: Snowflake Discounted Cash Flow (DCF) Analysis
A Discounted Cash Flow model estimates what a company is worth by projecting its future cash flows and discounting them back to today in dollar terms. For Snowflake, we use a 2 Stage Free Cash Flow to Equity approach built on both analyst forecasts and longer term extrapolations.
Snowflake generated about $758.8 million in free cash flow over the last twelve months. Analyst and model projections see this rising to roughly $2.9 billion by 2030, with interim years stepping up from just over $1.1 billion in 2026 to around $1.9 billion by 2028 before moving above $4 billion by 2034. These figures reflect the cash flow growth that is currently expected as Snowflake scales its data and AI platform.
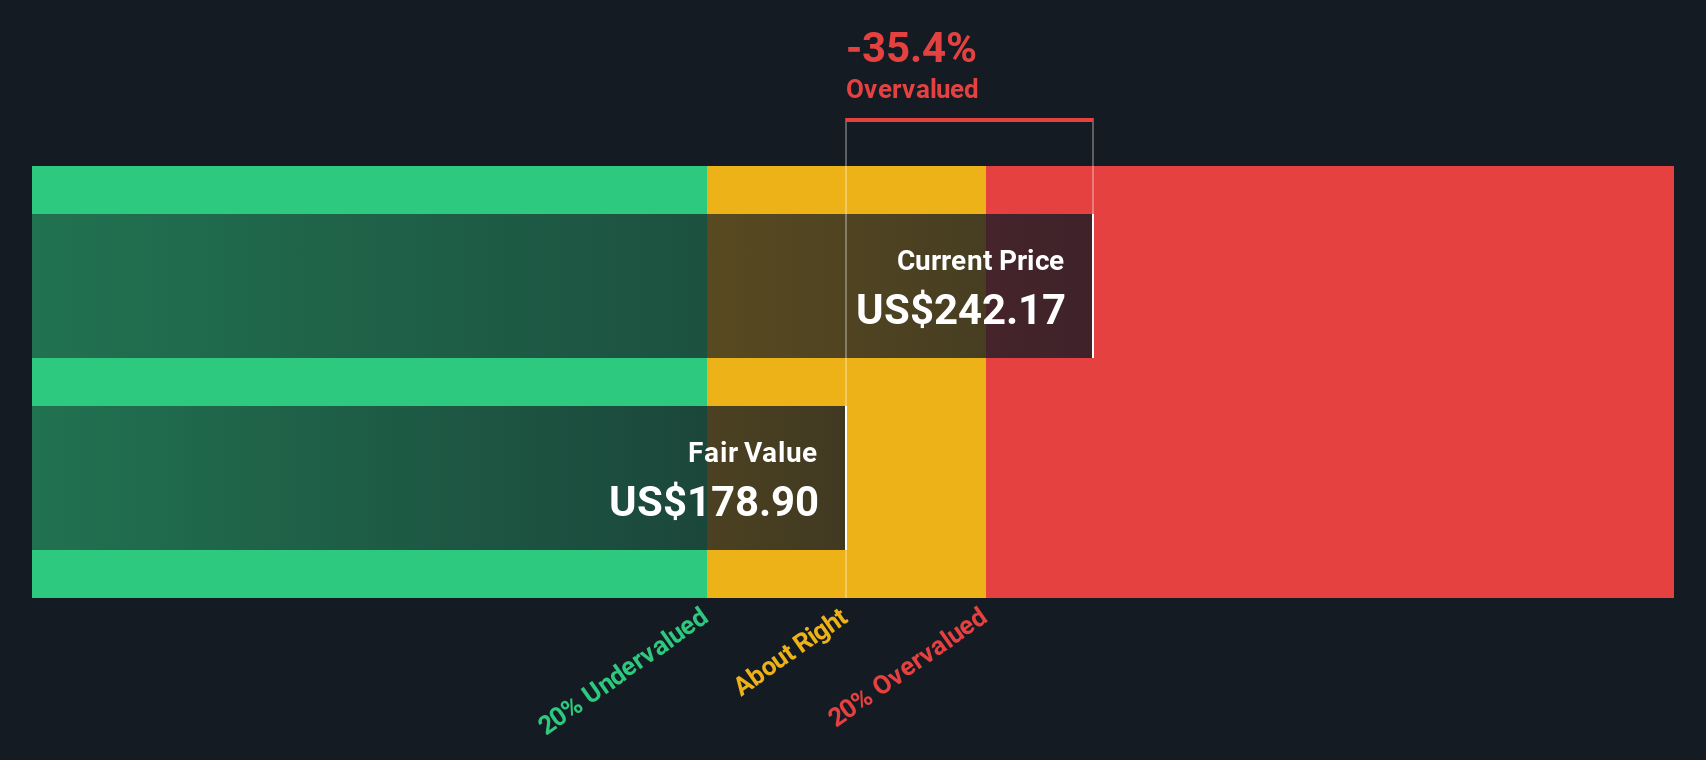
When those future cash flows are discounted back to today, the DCF model produces an estimated intrinsic value of about $153.71 per share. In this framework, the stock screens as roughly 43.5% above its current market price, indicating that the market is already pricing in a very strong growth trajectory.
Result: OVERVALUED
Our Discounted Cash Flow (DCF) analysis suggests Snowflake may be overvalued by 43.5%. Discover 911 undervalued stocks or create your own screener to find better value opportunities.
Approach 2: Snowflake Price vs Sales
For high growth, still maturing software businesses like Snowflake, the price to sales multiple is often the cleanest way to compare value because profits are being intentionally reinvested for expansion, which makes earnings based metrics less useful.
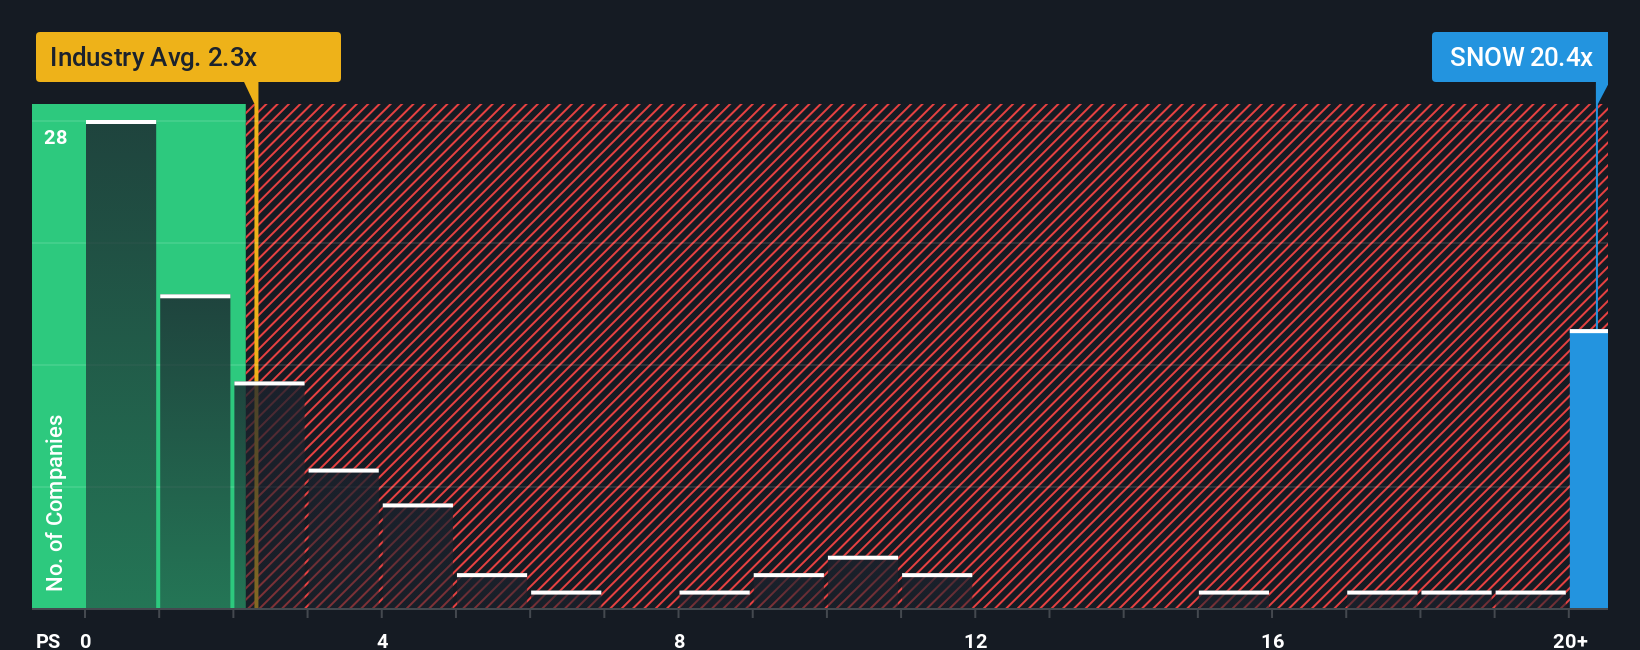
In general, faster revenue growth and lower perceived risk justify a higher normal or fair price to sales ratio, while slower growth or higher risk call for a lower one. Snowflake currently trades on about 17.21x sales, which is a hefty premium to the broader IT industry average of around 2.27x, but actually sits below the 20.71x peer group average. This reflects its competitive position as well as the recent pullback in sentiment.
Simply Wall St’s Fair Ratio for Snowflake, at 12.53x, is a proprietary estimate of the multiple that would be warranted given its specific mix of growth, profitability profile, industry, market cap and risk factors. This can be more informative than simple peer or industry comparisons, which may overlook differences in business quality and risk. Compared with the current 17.21x, Snowflake appears more expensive than what its fundamentals alone would suggest.
Result: OVERVALUED
PS ratios tell one story, but what if the real opportunity lies elsewhere? Discover 1458 companies where insiders are betting big on explosive growth.
Upgrade Your Decision Making: Choose your Snowflake Narrative
Earlier we mentioned that there is an even better way to understand valuation. Let us introduce you to Narratives, a simple way to connect your view of Snowflake’s business with the numbers by telling a story about how you think its revenue, earnings and margins will evolve, turning that into a forecast and then into a fair value that you can easily compare with today’s share price to decide whether to buy, hold or sell.
On Simply Wall St, Narratives live in the Community page and are used by millions of investors. They update dynamically as new news, earnings and guidance arrive, so your fair value estimate automatically stays in sync with the latest information while still reflecting your own assumptions.
For example, one Snowflake investor might build a bullish Narrative that leans toward the higher end of current fair value estimates, around $282 per share, based on strong, AI driven demand and rising margins. A more cautious investor might emphasize competitive risks, slower adoption or margin pressure and land closer to the lower end of recent analyst price targets nearer $170. This shows how different but clearly framed stories can justify very different views on whether Snowflake is attractively priced today.
Do you think there's more to the story for Snowflake? Head over to our Community to see what others are saying!
This article by Simply Wall St is general in nature. We provide commentary based on historical data and analyst forecasts only using an unbiased methodology and our articles are not intended to be financial advice. It does not constitute a recommendation to buy or sell any stock, and does not take account of your objectives, or your financial situation. We aim to bring you long-term focused analysis driven by fundamental data. Note that our analysis may not factor in the latest price-sensitive company announcements or qualitative material. Simply Wall St has no position in any stocks mentioned.
Have feedback on this article? Concerned about the content? Get in touch with us directly. Alternatively, email editorial-team@simplywallst.com