
 Nasdaq
 华尔街日报
华尔街日报Is It Too Late to Consider Ionis After Its 126% Surge in 2025?
- If you are wondering whether Ionis Pharmaceuticals is still worth considering after its huge run, or if the easy money has already been made, this breakdown is for you.
- The stock has risen 125.9% year to date and is up 108.0% over the last year, even after a recent 0.6% slip over the past week and a 9.5% gain in the last month.
- Those gains have come alongside growing optimism around its antisense drug pipeline and partnerships with major pharma names, as investors reassess the long term potential of its technology. Regulatory milestones and pipeline progress have helped shift sentiment from a more speculative story to a more concrete growth narrative.
- Despite that surge, Ionis scores just 2 out of 6 on our valuation checks. Below, we unpack what different valuation methods say about the stock and why a more holistic way of thinking about value, which we will get to at the end, may matter even more.
Ionis Pharmaceuticals scores just 2/6 on our valuation checks. See what other red flags we found in the full valuation breakdown.
Approach 1: Ionis Pharmaceuticals Discounted Cash Flow (DCF) Analysis
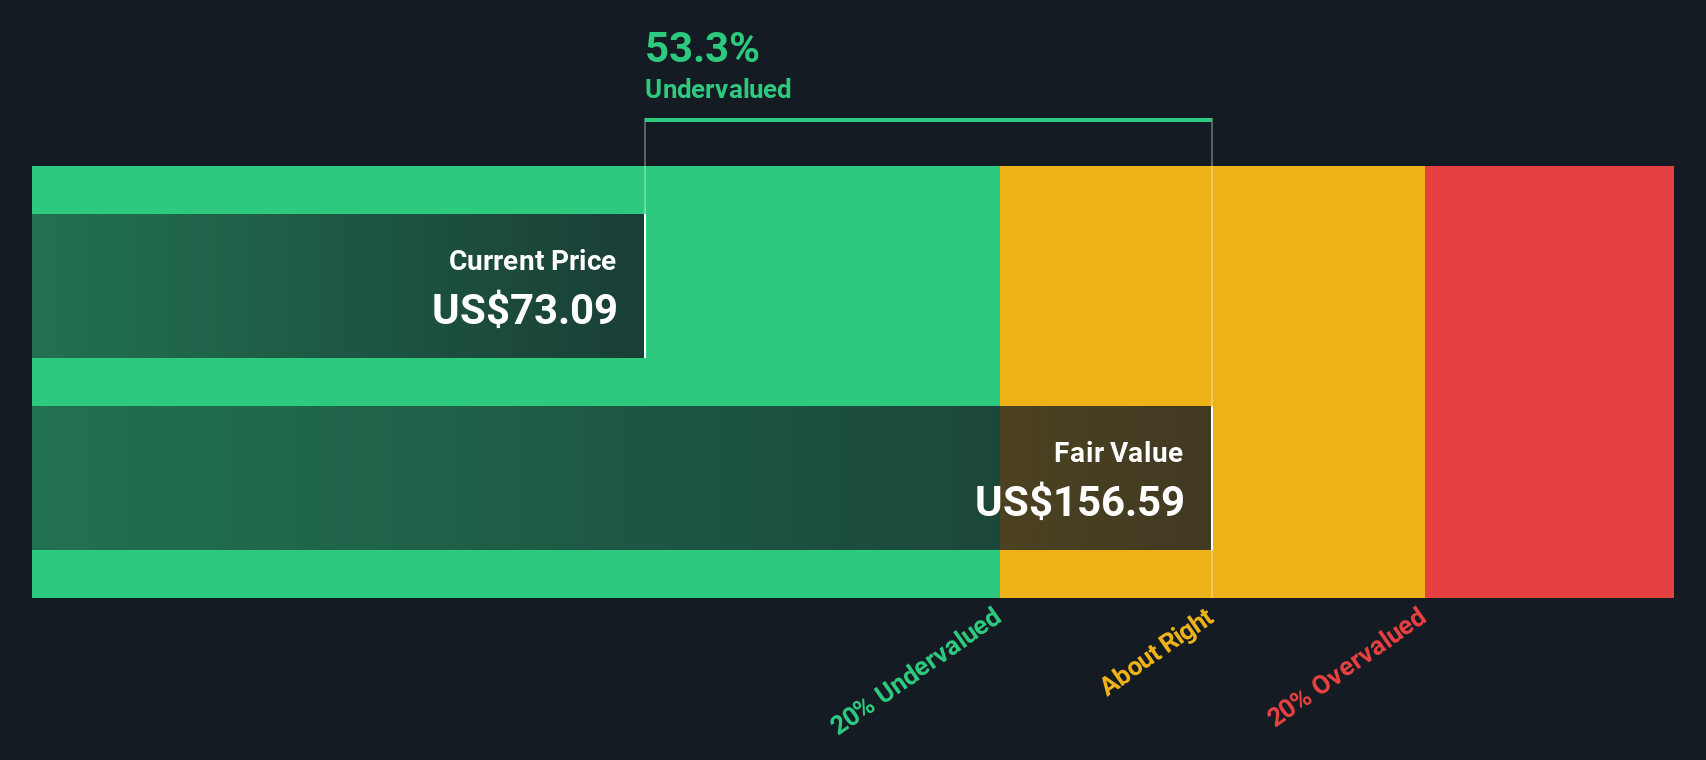
A Discounted Cash Flow model estimates what a business is worth today by projecting its future cash flows and discounting them back to a present value. For Ionis Pharmaceuticals, the 2 Stage Free Cash Flow to Equity model starts from a last twelve months Free Cash Flow of about $294.8 Million in the red, reflecting heavy investment and uneven profitability.
Analysts expect cash flows to gradually improve, with projections turning positive to around $356 Million by 2029. Beyond the analyst horizon, Simply Wall St extrapolates those forecasts, with Free Cash Flow rising to roughly $1.85 Billion by 2035 as key antisense therapies scale. Using these projections and an appropriate discount rate, the model estimates an intrinsic value of about $166.44 per share.
Compared with the current share price, this implies the stock is roughly 52.9% undervalued. This suggests the market is still not fully pricing in Ionis Pharmaceuticals long term cash generation potential.
Result: UNDERVALUED
Our Discounted Cash Flow (DCF) analysis suggests Ionis Pharmaceuticals is undervalued by 52.9%. Track this in your watchlist or portfolio, or discover 909 more undervalued stocks based on cash flows.
Approach 2: Ionis Pharmaceuticals Price vs Sales
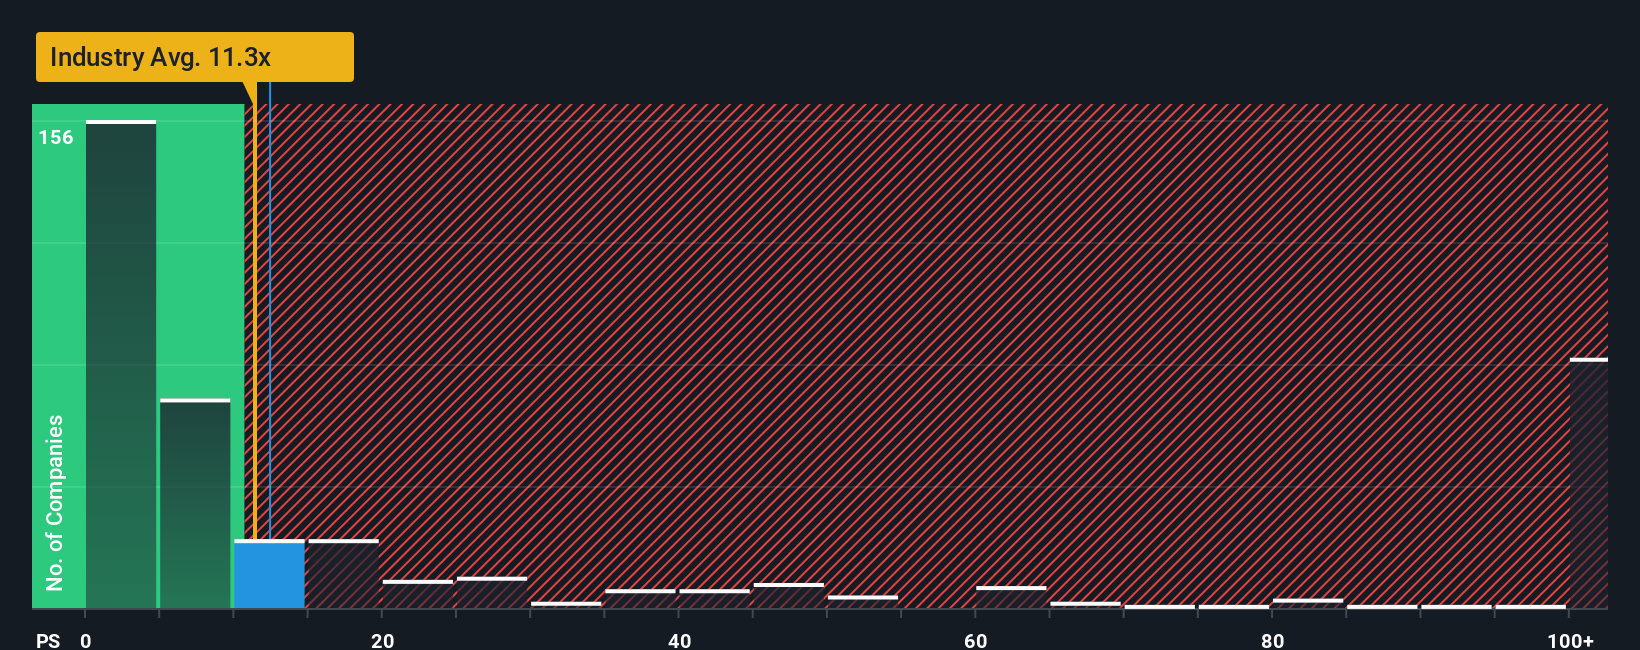
For companies like Ionis that are still moving toward consistent profitability, revenue is often a more stable anchor than earnings, which makes the Price to Sales ratio a useful way to gauge what investors are paying for each dollar of current sales.
In general, faster growth and lower perceived risk can justify a higher multiple, while slower growth or higher risk can argue for a lower, more conservative number. Ionis currently trades on a Price to Sales ratio of about 13.13x, slightly above the broader biotech industry average of roughly 12.31x and well above the peer group average of around 4.40x, indicating that investors are already paying a premium compared with many similar companies.
Simply Wall St’s Fair Ratio framework estimates what a reasonable Price to Sales multiple could be for Ionis, at about 4.75x, after accounting for its revenue growth outlook, profitability profile, risk factors, industry, and market cap. This company-specific Fair Ratio is more informative than a simple peer or industry comparison because it adjusts for the nuances in Ionis’s business rather than assuming all biotechs should trade at the same multiple. With the current 13.13x Price to Sales sitting well above the 4.75x Fair Ratio, the shares appear significantly overvalued on this measure.
Result: OVERVALUED
PS ratios tell one story, but what if the real opportunity lies elsewhere? Discover 1457 companies where insiders are betting big on explosive growth.
Upgrade Your Decision Making: Choose your Ionis Pharmaceuticals Narrative
Earlier we mentioned that there is an even better way to understand valuation. Let us introduce you to Narratives, a simple way to connect your view of the Ionis Pharmaceuticals story with a set of numbers like future revenue, earnings, margins and a fair value estimate. All of this is packaged into an easy to use tool on Simply Wall St’s Community page that millions of investors already use to decide when to buy or sell by comparing their Narrative Fair Value with the current share price. These Narratives automatically update as new news or earnings arrive. For example, a bullish investor who believes Ionis will successfully scale multiple late stage launches might build a Narrative that supports a fair value closer to the high analyst target of about 96 dollars per share. A more cautious investor, focused on pricing pressure and execution risk, might lean toward a fair value nearer the low target of roughly 43 dollars. Each Narrative links a different story about the company to a clear forecast and price anchor.
Do you think there's more to the story for Ionis Pharmaceuticals? Head over to our Community to see what others are saying!

This article by Simply Wall St is general in nature. We provide commentary based on historical data and analyst forecasts only using an unbiased methodology and our articles are not intended to be financial advice. It does not constitute a recommendation to buy or sell any stock, and does not take account of your objectives, or your financial situation. We aim to bring you long-term focused analysis driven by fundamental data. Note that our analysis may not factor in the latest price-sensitive company announcements or qualitative material. Simply Wall St has no position in any stocks mentioned.
Have feedback on this article? Concerned about the content? Get in touch with us directly. Alternatively, email editorial-team@simplywallst.com