
 Nasdaq
 华尔街日报
华尔街日报Is It Too Late To Consider BlackRock After Strong Five Year Share Price Gains?
- If you are wondering whether BlackRock is still attractive at current levels or if the easy money has already been made, this breakdown will help you see what the market is really pricing in.
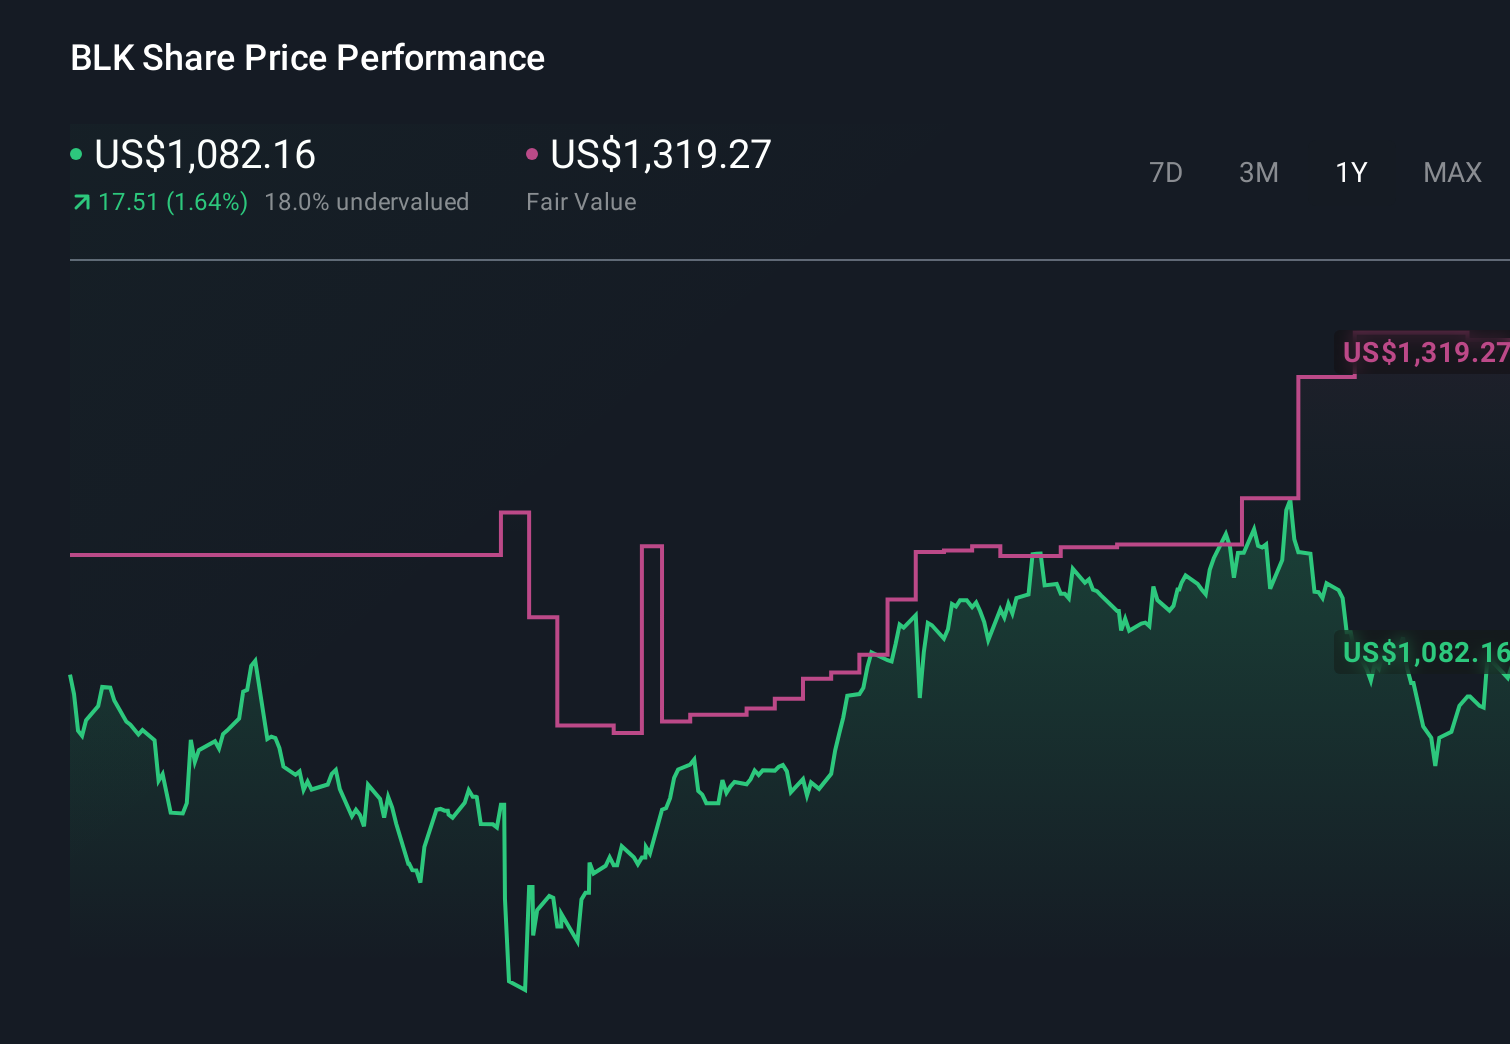
- With the stock at about $1,082, up 1.9% over the last week, 2.3% over the last month, 6.4% year to date, and delivering 74.6% over five years, investors are clearly paying up for its track record.
- Recent moves have been shaped by themes like accelerating demand for low cost ETFs, growing institutional interest in alternative assets, and BlackRock’s expanding role as a key infrastructure player in global capital markets. At the same time, debates over regulation, fees, and the future of active management keep a floor under perceived risk.
- On our scorecard BlackRock only scores 2 / 6 for undervaluation across our checks. In this article, we will walk through what different valuation approaches say, and why a more nuanced framework at the end may change how you see that score.
BlackRock scores just 2/6 on our valuation checks. See what other red flags we found in the full valuation breakdown.
Approach 1: BlackRock Excess Returns Analysis
The Excess Returns model looks at how much profit BlackRock can generate above the return that investors require on its equity, and then capitalizes those excess profits into an intrinsic value per share.
For BlackRock, the starting point is a Book Value of $357.90 per share and a Stable EPS of $51.83 per share, based on weighted future Return on Equity estimates from 5 analysts. This implies an Average Return on Equity of 15.94%, which is comfortably above the required Cost of Equity of $26.99 per share. The gap between these two, the Excess Return, is $24.85 per share, suggesting BlackRock is expected to keep creating value on each dollar of equity it reinvests.
The model also assumes a Stable Book Value of $325.09 per share, sourced from 4 analysts, and projects those excess returns forward to estimate intrinsic value. On this basis, the Excess Returns valuation implies the stock is about 32.3% overvalued relative to the current price.
Result: OVERVALUED
Our Excess Returns analysis suggests BlackRock may be overvalued by 32.3%. Discover 913 undervalued stocks or create your own screener to find better value opportunities.
Approach 2: BlackRock Price vs Earnings
For a mature, consistently profitable business like BlackRock, the price to earnings ratio is a natural starting point because it links what investors pay directly to the earnings the company generates today.
In general, companies with stronger, more reliable growth prospects and lower risk profiles deserve higher PE ratios, while slower growing or riskier firms tend to trade at lower multiples. The market effectively uses the PE as a quick summary of how confident it is about a company’s future earnings power.
BlackRock currently trades on a PE of about 27.5x, which is modestly above the broader Capital Markets industry average of roughly 25.0x but well below the peer group average of around 46.7x. Simply Wall St’s Fair Ratio for BlackRock is 19.5x, a proprietary estimate of what a reasonable PE would be given its earnings growth outlook, margins, industry, market cap and risk profile. This makes it more informative than a simple comparison with peers or the industry because it adjusts for BlackRock’s specific fundamentals rather than assuming all companies deserve similar multiples. With the current PE sitting meaningfully above the Fair Ratio, the stock screens as overvalued on this metric.
Result: OVERVALUED

PE ratios tell one story, but what if the real opportunity lies elsewhere? Discover 1455 companies where insiders are betting big on explosive growth.
Upgrade Your Decision Making: Choose your BlackRock Narrative
Earlier we mentioned that there is an even better way to understand valuation, so let us introduce you to Narratives, a simple framework on Simply Wall St’s Community page. With Narratives, you attach your own story about BlackRock’s future to concrete numbers like revenue growth, earnings, margins and a fair value estimate. You can then compare that fair value to today’s price to decide whether to buy or sell. The whole view updates dynamically as new news or earnings arrive. One investor might build a bullish BlackRock Narrative that leans toward the upper end of current targets, assuming AI infrastructure, alternatives and emerging markets can justify a fair value closer to $1,319 per share. A more cautious investor might anchor nearer the low end around $1,000, reflecting worries about regulation, fee pressure and integration risk. Yet both are using the same tool, linking a clear story to a transparent forecast and a live, comparable fair value that makes it easier to see whether their conviction really lines up with the market price.
Do you think there's more to the story for BlackRock? Head over to our Community to see what others are saying!
This article by Simply Wall St is general in nature. We provide commentary based on historical data and analyst forecasts only using an unbiased methodology and our articles are not intended to be financial advice. It does not constitute a recommendation to buy or sell any stock, and does not take account of your objectives, or your financial situation. We aim to bring you long-term focused analysis driven by fundamental data. Note that our analysis may not factor in the latest price-sensitive company announcements or qualitative material. Simply Wall St has no position in any stocks mentioned.
Have feedback on this article? Concerned about the content? Get in touch with us directly. Alternatively, email editorial-team@simplywallst.com