
 Nasdaq
 华尔街日报
华尔街日报Berkshire Hathaway (BRK.A) Valuation Check as Greg Abel’s New Leadership Team Takes Shape
Berkshire Hathaway (BRK.A) just laid out a sweeping leadership handoff, from long time CFO Marc Hamburg to Charles Chang and a broader reshuffle under incoming CEO Greg Abel, giving investors fresh visibility into the post Buffett era.
See our latest analysis for Berkshire Hathaway.
Those moves come as Berkshire’s Class A shares trade around $758,900.01, with a solid year to date share price return of 12.35 percent and an impressive five year total shareholder return of 124.25 percent, suggesting momentum remains constructive rather than exhausted.
If this leadership transition has you thinking about what else could reshape your portfolio, it is a good time to explore fast growing stocks with high insider ownership for other under the radar opportunities.
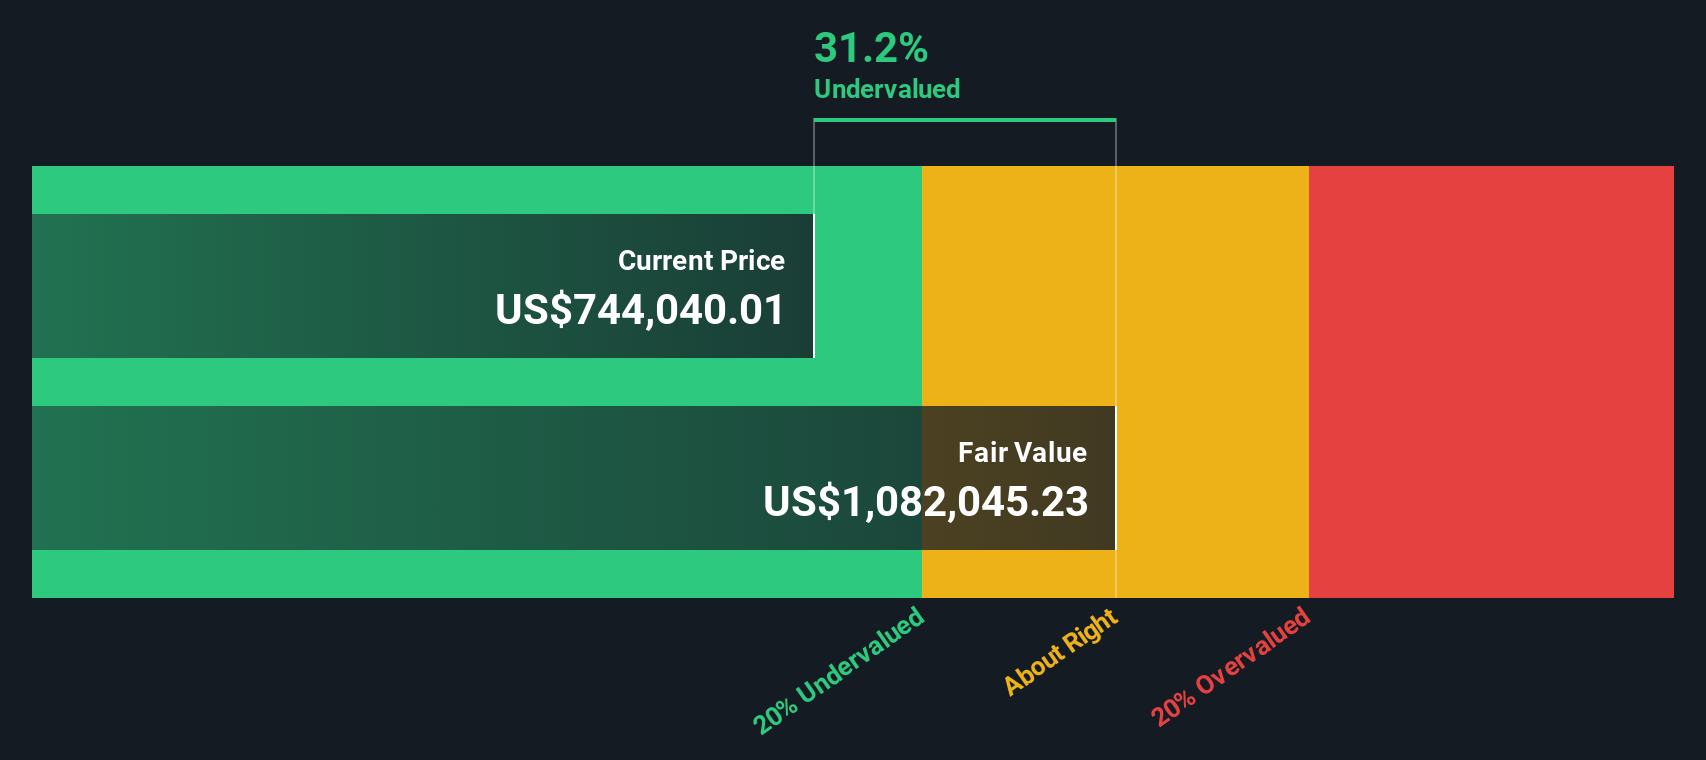
With shares hovering just below analyst targets but trading at a hefty intrinsic discount, is Berkshire quietly on sale ahead of Greg Abel’s tenure, or has the market already priced in the next chapter of growth?
Price-to-Earnings of 16.2x: Is it justified?
Berkshire Hathaway currently trades on a price to earnings ratio of 16.2 times, slightly richer than peers despite the last close sitting well below intrinsic value models.
The price to earnings multiple compares the share price with the company’s per share earnings. This makes it a direct gauge of how much investors are paying for every dollar of profit at a diversified financial conglomerate like Berkshire.
In Berkshire’s case, the market is attaching a premium to current earnings versus the broader US diversified financials space, where the average multiple is 13.6 times. Yet against a peer set that trades closer to 26.3 times, Berkshire still looks comparatively restrained, and close to the 16.9 times fair price to earnings ratio that our regression based fair multiple suggests the market could converge toward.
That mix of modest premium to the core industry, large discount to peers and alignment with the fair ratio suggests that investors are willing to pay somewhat more for Berkshire’s high quality earnings and seasoned leadership, but not to the same extent as for faster growing or more narrowly focused financial names.
Explore the SWS fair ratio for Berkshire Hathaway
Result: Price-to-Earnings of 16.2x (ABOUT RIGHT)
However, investors still face risks, including slowing net income growth and potential execution missteps as Berkshire navigates leadership changes and capital allocation decisions.
Find out about the key risks to this Berkshire Hathaway narrative.
Another View: DCF Points to Deeper Value
While the price to earnings ratio says Berkshire is roughly fairly priced, our DCF model tells a different story. On that score, shares look about 34 percent below fair value, which implies the market may be underestimating long term cash generation.
Look into how the SWS DCF model arrives at its fair value.
Simply Wall St performs a discounted cash flow (DCF) on every stock in the world every day (check out Berkshire Hathaway for example). We show the entire calculation in full. You can track the result in your watchlist or portfolio and be alerted when this changes, or use our stock screener to discover 913 undervalued stocks based on their cash flows. If you save a screener we even alert you when new companies match - so you never miss a potential opportunity.
Build Your Own Berkshire Hathaway Narrative
If you want to dig into the numbers yourself or follow a different angle on Berkshire’s story, you can build a custom view in just a few minutes: Do it your way.
A great starting point for your Berkshire Hathaway research is our analysis highlighting 1 key reward and 2 important warning signs that could impact your investment decision.
Ready for your next investment move?
Before you stop at Berkshire, put Simply Wall Street’s powerful Screener to work so you do not miss high potential ideas hiding in plain sight.
- Capture growth at compelling prices by targeting companies our models flag as mispriced through these 913 undervalued stocks based on cash flows with strong cash flow support.
- Capitalize on the next wave of automation and productivity gains by focusing on innovators powering intelligent systems using these 25 AI penny stocks.
- Boost your portfolio’s income stream by zeroing in on reliable payers with attractive yields via these 13 dividend stocks with yields > 3%.
This article by Simply Wall St is general in nature. We provide commentary based on historical data and analyst forecasts only using an unbiased methodology and our articles are not intended to be financial advice. It does not constitute a recommendation to buy or sell any stock, and does not take account of your objectives, or your financial situation. We aim to bring you long-term focused analysis driven by fundamental data. Note that our analysis may not factor in the latest price-sensitive company announcements or qualitative material. Simply Wall St has no position in any stocks mentioned.
Have feedback on this article? Concerned about the content? Get in touch with us directly. Alternatively, email editorial-team@simplywallst.com