
 Nasdaq
 华尔街日报
华尔街日报Has Enphase’s Steep 56% Slide in 2025 Created a New Opportunity for Investors?
- Wondering if Enphase Energy is a beaten down gem or a value trap at today’s price? This article will walk you through what the numbers are really saying about the stock.
- The share price has slipped 0.6% over the last week, bounced 9.4% over the past month, but is still down a steep 56.0% year to date and 57.3% over the last year, with even deeper losses over 3 and 5 years.
- Those swings have come as investors reassess solar and clean energy names more broadly, with shifting sentiment around demand for residential solar installations and policy support in key markets. At the same time, the market has been reacting to changing expectations for interest rates and capital-intensive clean tech projects, both of which can heavily influence how stocks like Enphase are valued.
- On our valuation checks, Enphase scores a 4/6 value score, suggesting it may be undervalued on several fronts, but not across the board. Next, we will break down what different valuation methods say about the stock, and then finish with a more holistic way to think about Enphase’s true worth beyond just the headline multiples.
Find out why Enphase Energy's -57.3% return over the last year is lagging behind its peers.
Approach 1: Enphase Energy Discounted Cash Flow (DCF) Analysis
A Discounted Cash Flow model estimates what a company is worth by projecting the cash it can generate in the future and then discounting those cash flows back to today’s dollars. For Enphase Energy, the model used is a 2 Stage Free Cash Flow to Equity approach, based on cash flows in $.
Enphase’s last twelve months Free Cash Flow is about $203.4 million. Analysts expect this to rise meaningfully in coming years, with projections reaching roughly $614.8 million by 2035, as near term analyst forecasts are extended further into the future by Simply Wall St to build a full 10 year path.
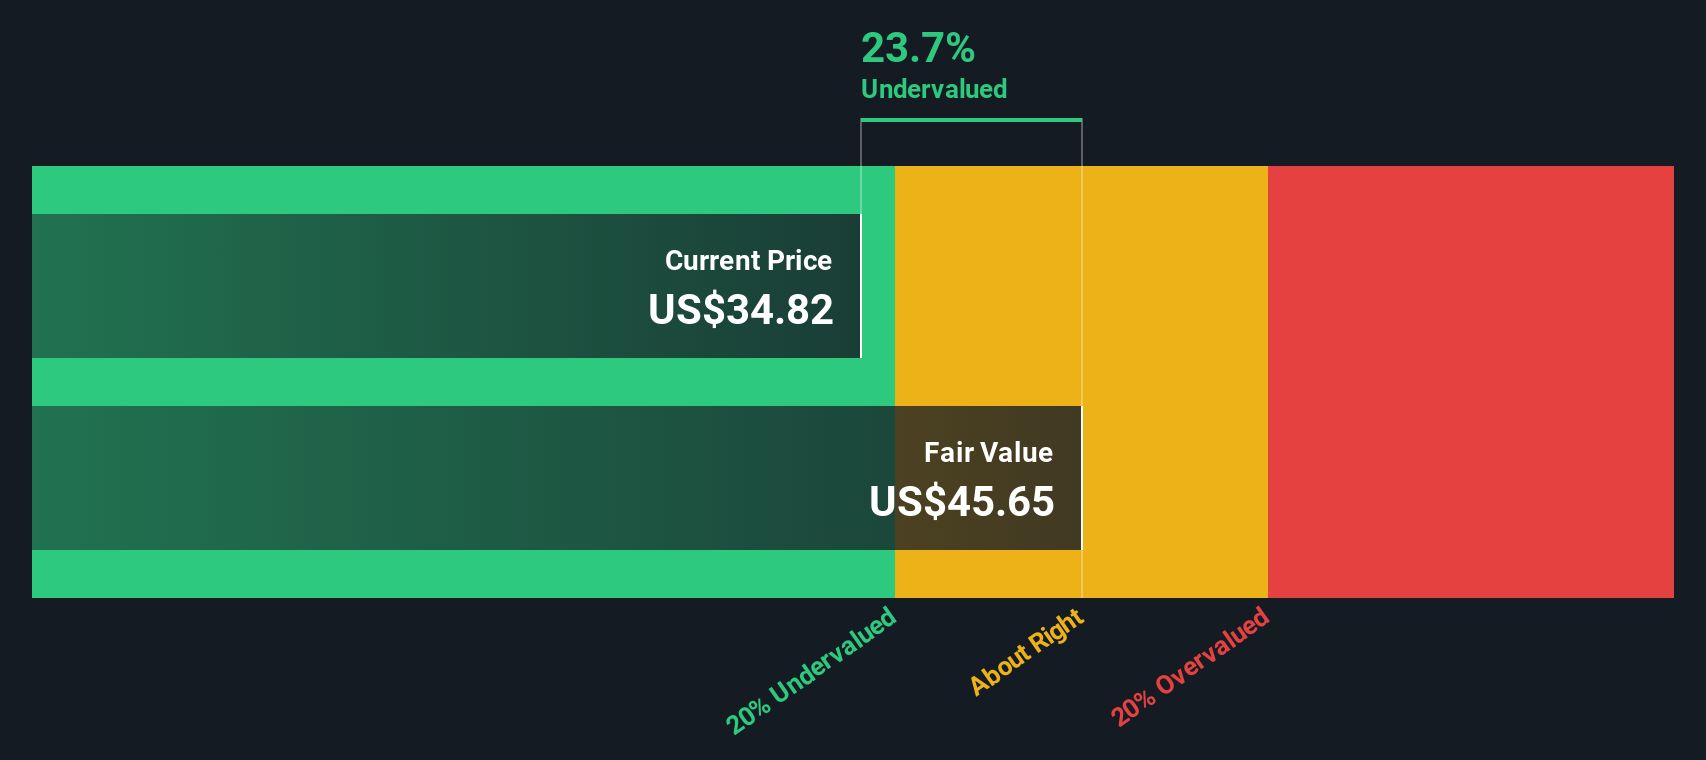
When all of those projected cash flows are discounted back, the model arrives at an intrinsic value of about $38.12 per share. That implies the stock is trading at roughly a 17.7% discount to its estimated fair value, suggesting the market may be pricing in a more pessimistic outlook than the cash flow story supports.
Result: UNDERVALUED
Our Discounted Cash Flow (DCF) analysis suggests Enphase Energy is undervalued by 17.7%. Track this in your watchlist or portfolio, or discover 912 more undervalued stocks based on cash flows.
Approach 2: Enphase Energy Price vs Earnings
For a profitable business like Enphase, the price to earnings ratio is a useful yardstick because it directly links what investors are paying to the profits the company is actually generating. In general, faster growing and lower risk companies can justify a higher PE, while slower growth or higher risk should mean a lower, more conservative multiple.
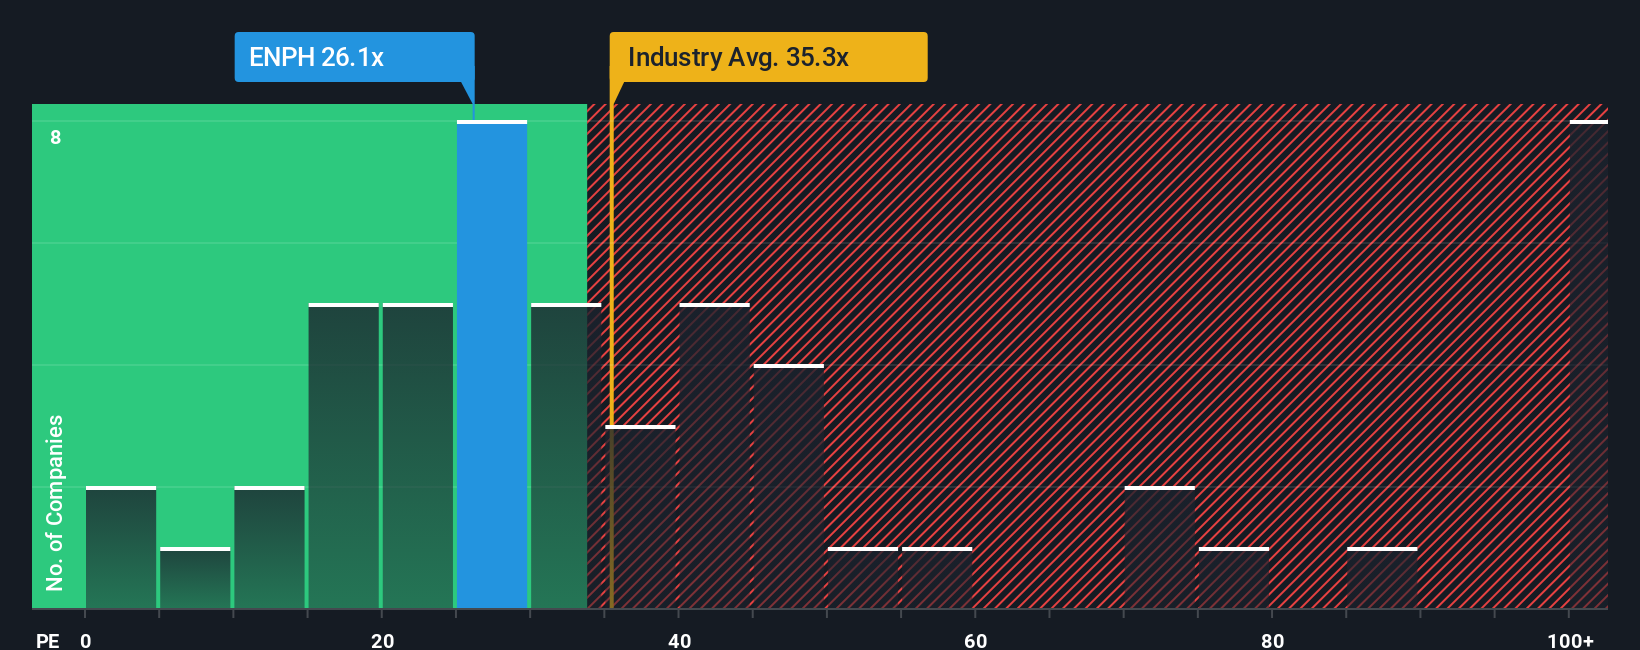
Enphase currently trades on a PE of about 21.0x. That is well below the broader semiconductor industry average of roughly 37.3x, and far under the approximate 61.8x seen across its closest peers, which might initially suggest the stock is cheap. However, simple peer comparisons can be misleading if those companies have different growth runways, margins, balance sheet strength or risk profiles.
This is where Simply Wall St’s Fair Ratio comes in. It is a proprietary estimate of what Enphase’s PE should be, given its specific earnings growth outlook, profitability, industry, market cap and risk factors. For Enphase, the Fair Ratio is around 24.3x, modestly above the current 21.0x. That gap points to a market price that is still discounting the company’s fundamentals.
Result: UNDERVALUED
PE ratios tell one story, but what if the real opportunity lies elsewhere? Discover 1455 companies where insiders are betting big on explosive growth.
Upgrade Your Decision Making: Choose your Enphase Energy Narrative
Earlier we mentioned that there is an even better way to understand valuation, so let us introduce you to Narratives, a simple framework that lets you spell out your story for a company, connect that story to a set of revenue, earnings and margin assumptions, and then see the Fair Value that falls out of that forecast in one place on Simply Wall St’s Community page.
Instead of just accepting a single target price or PE multiple, Narratives help you consider how your own view of Fair Value compares to the current share price. They update dynamically as new earnings reports, product launches or macro news arrive, so your view evolves with the facts rather than staying frozen in time.
For Enphase, one investor might build a bullish Narrative around a recovery in residential solar, successful global expansion and margin improvement that supports a Fair Value closer to the top of the current analyst range near $85. Another investor could focus on shrinking U.S. demand, execution and policy risks and tougher competition, leading them to a much lower Fair Value nearer the most cautious view around $27. Narratives allow both perspectives to be clearly expressed, quantified and compared.
Do you think there's more to the story for Enphase Energy? Head over to our Community to see what others are saying!

This article by Simply Wall St is general in nature. We provide commentary based on historical data and analyst forecasts only using an unbiased methodology and our articles are not intended to be financial advice. It does not constitute a recommendation to buy or sell any stock, and does not take account of your objectives, or your financial situation. We aim to bring you long-term focused analysis driven by fundamental data. Note that our analysis may not factor in the latest price-sensitive company announcements or qualitative material. Simply Wall St has no position in any stocks mentioned.
Have feedback on this article? Concerned about the content? Get in touch with us directly. Alternatively, email editorial-team@simplywallst.com