
 Nasdaq
 华尔街日报
华尔街日报Is Equinor Attractively Priced After 5 Year 143.2% Surge And 2025 Transition Headlines?
- Wondering if Equinor is a bargain or a value trap at today’s price? Here is a breakdown of what the recent share performance and fundamentals are really telling us before you make your next move.
- Despite being up an impressive 143.2% over the last 5 years, the stock is down 16.6% year to date and roughly flat over 1 year, which hints that the market is still undecided about its next leg.
- Recently, Equinor has stayed in the spotlight with headlines around its transition strategy in European energy markets and continued investment in offshore projects, all while broader energy prices have been choppy. Together, these factors are reshaping how investors think about its long term earnings power and risk profile.
- Even with that mixed backdrop, Equinor currently scores a solid 5/6 on our valuation checks. This suggests the market may be underpricing parts of its story, at least on traditional metrics. Next, we will walk through those valuation approaches in detail, then finish by exploring a more nuanced way to think about what Equinor is really worth.
Find out why Equinor's -1.2% return over the last year is lagging behind its peers.
Approach 1: Equinor Discounted Cash Flow (DCF) Analysis
A Discounted Cash Flow model estimates what a company is worth by projecting the cash it can generate in the future and then discounting those cash flows back to today in today’s dollars.
For Equinor, the 2 Stage Free Cash Flow to Equity model starts from last twelve months free cash flow of about $8.96 billion and uses analyst forecasts for the next few years, then extends those trends further out. Analyst and extrapolated projections see free cash flow easing back toward around $5.78 billion by 2029, with additional, gradually growing estimates through 2035 supplied by Simply Wall St to complete the long term picture.
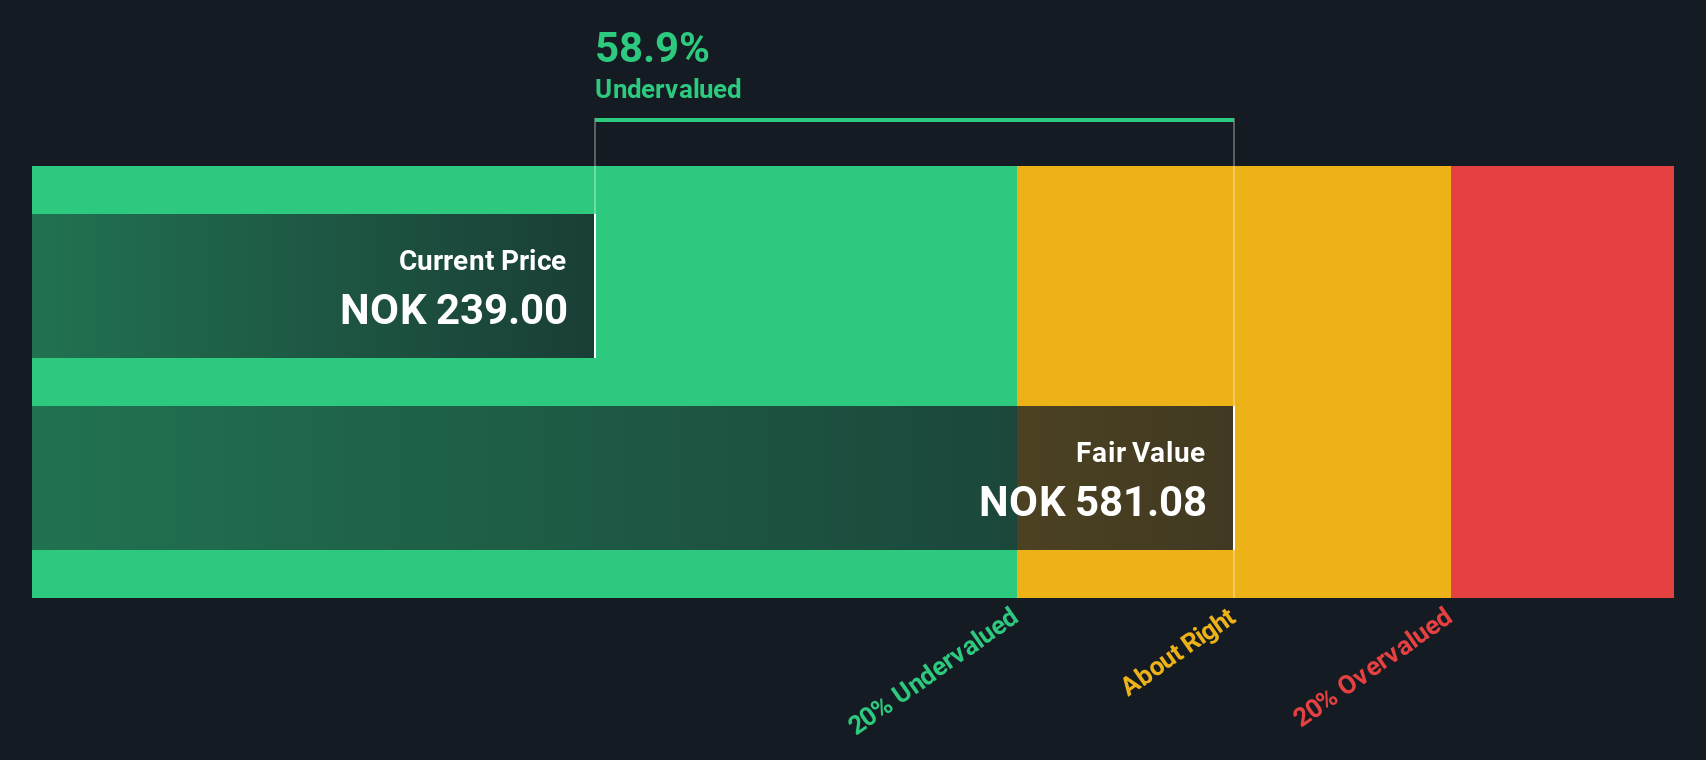
When all those future cash flows are discounted back, the model arrives at an intrinsic value of roughly NOK 620.70 per share. Compared with the current share price, this implies Equinor is trading at a 62.6% discount to its estimated fair value. This suggests the market is being very cautious about its long term cash generation and energy price risks.
Result: UNDERVALUED
Our Discounted Cash Flow (DCF) analysis suggests Equinor is undervalued by 62.6%. Track this in your watchlist or portfolio, or discover 907 more undervalued stocks based on cash flows.
Approach 2: Equinor Price vs Earnings
For profitable companies like Equinor, the Price to Earnings (PE) ratio is a straightforward way to gauge how much investors are paying for each unit of current earnings. In general, faster growth and lower perceived risk justify a higher PE, while slower growth or higher risk usually means a lower, more conservative multiple is appropriate.
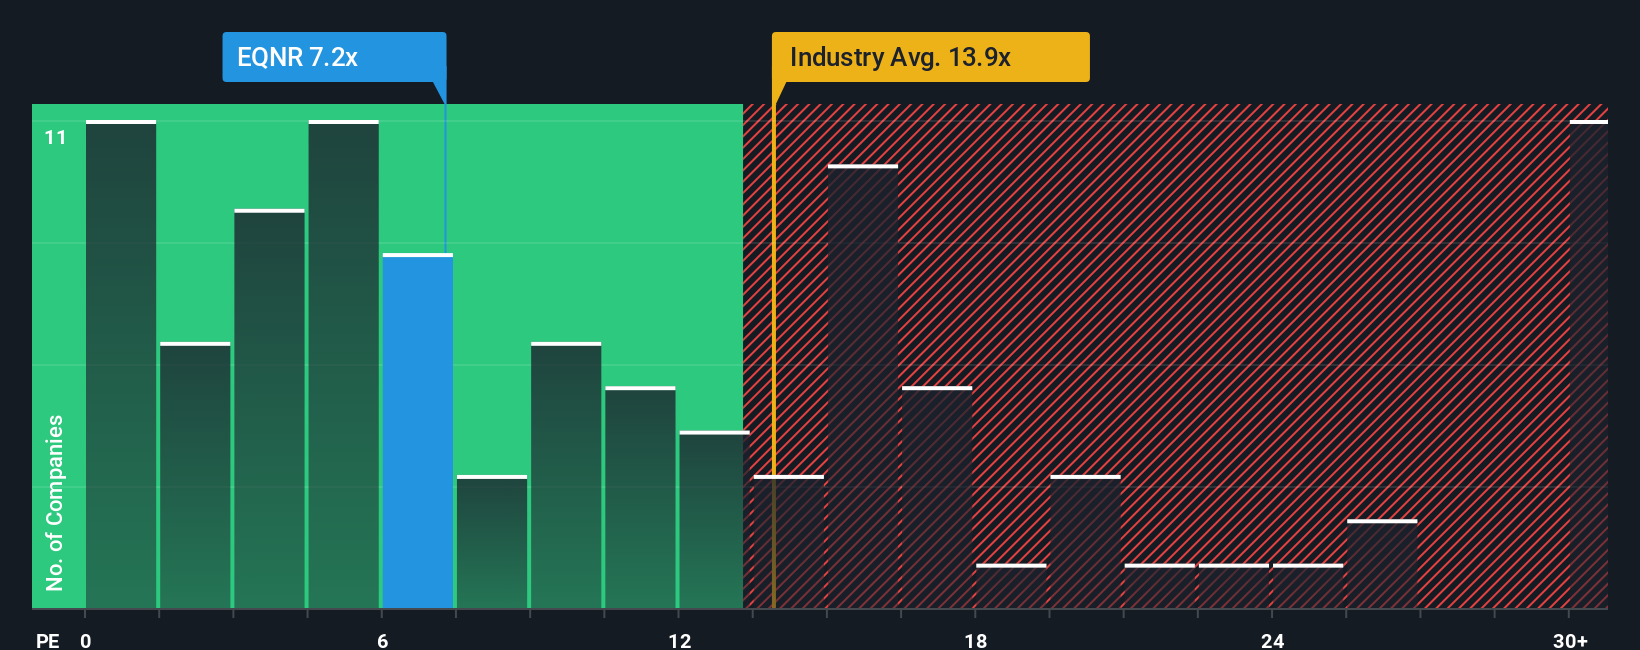
Equinor currently trades on a PE of about 10x, which sits below both the Oil and Gas industry average of roughly 13.2x and the broader peer average of around 16.1x. That discount hints that the market is pricing in more risk or weaker durability of earnings than for typical peers. To cut through those broad comparisons, Simply Wall St uses a proprietary Fair Ratio, which estimates what a normal PE should be for Equinor given its earnings growth outlook, profitability, industry, size and risk factors. This tailored Fair Ratio for Equinor is about 10.2x, making it a more precise benchmark than simple industry or peer averages.
With the current PE of 10x sitting slightly below the Fair Ratio of 10.2x, Equinor screens as modestly undervalued on earnings, rather than a clear bargain or a clear trap at today’s price.
Result: UNDERVALUED
PE ratios tell one story, but what if the real opportunity lies elsewhere? Discover 1448 companies where insiders are betting big on explosive growth.
Upgrade Your Decision Making: Choose your Equinor Narrative
Earlier we mentioned that there is an even better way to understand valuation, so let us introduce you to Narratives, which are simply the stories investors tell about a company’s future and then translate into numbers like revenue, earnings, margins and ultimately a fair value. A Narrative on Simply Wall St, available in the Community page used by millions of investors, connects what you believe about Equinor’s strategy, risks and opportunities to a specific financial forecast and a fair value estimate, so you can quickly compare that fair value with today’s share price to decide whether it looks like a buy, hold or sell. Narratives update dynamically as fresh information arrives, such as new project announcements, shifting analyst forecasts or quarterly earnings, so your view can evolve instead of staying frozen at one point in time. For example, one Equinor Narrative on the platform may assume stronger execution in renewables and capital returns, supporting a fair value closer to NOK 321 per share. In contrast, a more cautious Narrative focused on rising transition risks and softer long term cash flows lands nearer NOK 180, highlighting how different but clearly quantified perspectives can coexist and guide better decisions.
Do you think there's more to the story for Equinor? Head over to our Community to see what others are saying!

This article by Simply Wall St is general in nature. We provide commentary based on historical data and analyst forecasts only using an unbiased methodology and our articles are not intended to be financial advice. It does not constitute a recommendation to buy or sell any stock, and does not take account of your objectives, or your financial situation. We aim to bring you long-term focused analysis driven by fundamental data. Note that our analysis may not factor in the latest price-sensitive company announcements or qualitative material. Simply Wall St has no position in any stocks mentioned.
Have feedback on this article? Concerned about the content? Get in touch with us directly. Alternatively, email editorial-team@simplywallst.com