
 Nasdaq
 华尔街日报
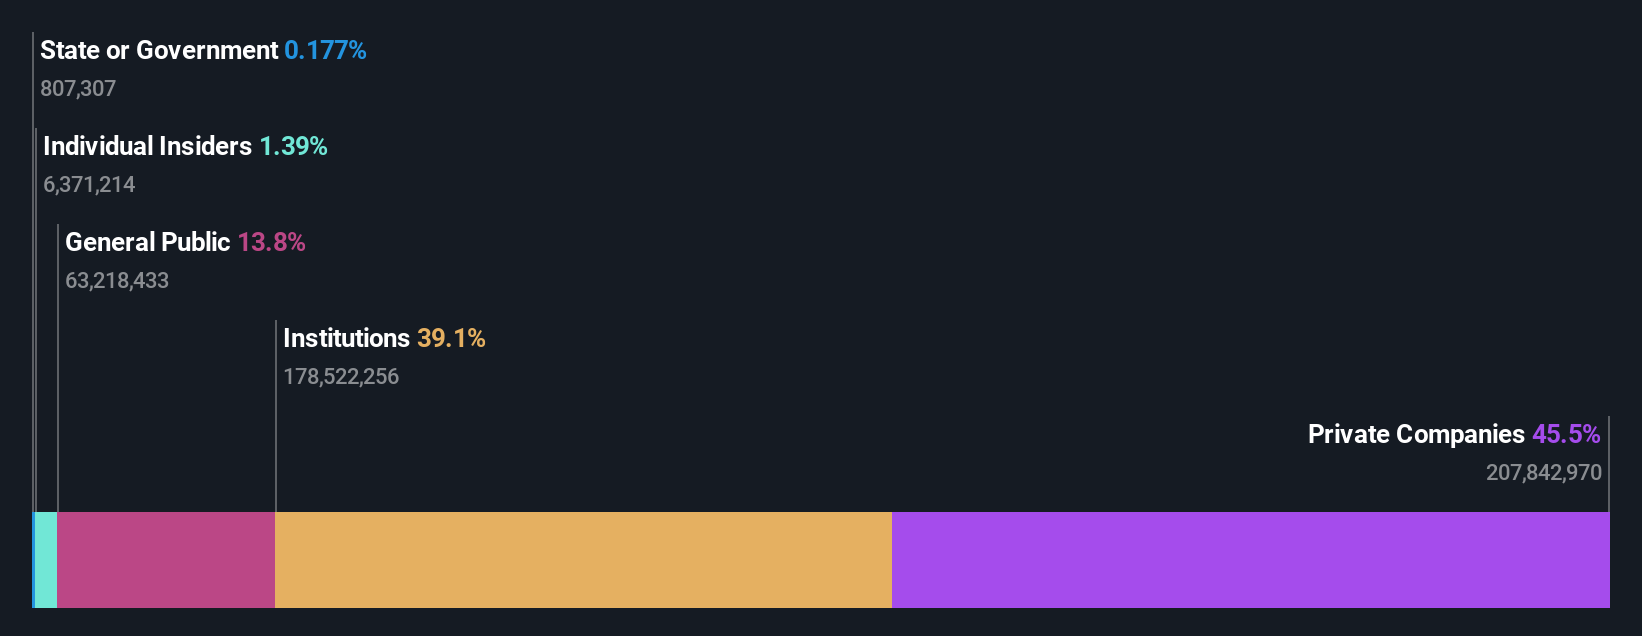
华尔街日报While institutions own 39% of Lupin Limited (NSE:LUPIN), private companies are its largest shareholders with 46% ownership
Key Insights
- Significant control over Lupin by private companies implies that the general public has more power to influence management and governance-related decisions
- The top 2 shareholders own 52% of the company
- Institutions own 39% of Lupin
To get a sense of who is truly in control of Lupin Limited (NSE:LUPIN), it is important to understand the ownership structure of the business. And the group that holds the biggest piece of the pie are private companies with 46% ownership. Put another way, the group faces the maximum upside potential (or downside risk).
Meanwhile, institutions make up 39% of the company’s shareholders. Generally speaking, as a company grows, institutions will increase their ownership. Conversely, insiders often decrease their ownership over time.
In the chart below, we zoom in on the different ownership groups of Lupin.
See our latest analysis for Lupin
What Does The Institutional Ownership Tell Us About Lupin?
Institutional investors commonly compare their own returns to the returns of a commonly followed index. So they generally do consider buying larger companies that are included in the relevant benchmark index.
As you can see, institutional investors have a fair amount of stake in Lupin. This can indicate that the company has a certain degree of credibility in the investment community. However, it is best to be wary of relying on the supposed validation that comes with institutional investors. They too, get it wrong sometimes. When multiple institutions own a stock, there's always a risk that they are in a 'crowded trade'. When such a trade goes wrong, multiple parties may compete to sell stock fast. This risk is higher in a company without a history of growth. You can see Lupin's historic earnings and revenue below, but keep in mind there's always more to the story.

We note that hedge funds don't have a meaningful investment in Lupin. The company's largest shareholder is Lupin Investments Pvt. Ltd., with ownership of 45%. Meanwhile, the second and third largest shareholders, hold 6.2% and 3.2%, of the shares outstanding, respectively.
To make our study more interesting, we found that the top 2 shareholders have a majority ownership in the company, meaning that they are powerful enough to influence the decisions of the company.
While studying institutional ownership for a company can add value to your research, it is also a good practice to research analyst recommendations to get a deeper understand of a stock's expected performance. Quite a few analysts cover the stock, so you could look into forecast growth quite easily.
Insider Ownership Of Lupin
The definition of an insider can differ slightly between different countries, but members of the board of directors always count. Company management run the business, but the CEO will answer to the board, even if he or she is a member of it.
Insider ownership is positive when it signals leadership are thinking like the true owners of the company. However, high insider ownership can also give immense power to a small group within the company. This can be negative in some circumstances.
We can see that insiders own shares in Lupin Limited. The insiders have a meaningful stake worth ₹13b. Most would say this shows a good alignment of interests between shareholders and the board. Still, it might be worth checking if those insiders have been selling.
General Public Ownership
With a 14% ownership, the general public, mostly comprising of individual investors, have some degree of sway over Lupin. While this group can't necessarily call the shots, it can certainly have a real influence on how the company is run.
Private Company Ownership
Our data indicates that Private Companies hold 46%, of the company's shares. Private companies may be related parties. Sometimes insiders have an interest in a public company through a holding in a private company, rather than in their own capacity as an individual. While it's hard to draw any broad stroke conclusions, it is worth noting as an area for further research.
Next Steps:
I find it very interesting to look at who exactly owns a company. But to truly gain insight, we need to consider other information, too. Case in point: We've spotted 2 warning signs for Lupin you should be aware of, and 1 of them is concerning.
If you are like me, you may want to think about whether this company will grow or shrink. Luckily, you can check this free report showing analyst forecasts for its future.
NB: Figures in this article are calculated using data from the last twelve months, which refer to the 12-month period ending on the last date of the month the financial statement is dated. This may not be consistent with full year annual report figures.
Have feedback on this article? Concerned about the content? Get in touch with us directly. Alternatively, email editorial-team (at) simplywallst.com.
This article by Simply Wall St is general in nature. We provide commentary based on historical data and analyst forecasts only using an unbiased methodology and our articles are not intended to be financial advice. It does not constitute a recommendation to buy or sell any stock, and does not take account of your objectives, or your financial situation. We aim to bring you long-term focused analysis driven by fundamental data. Note that our analysis may not factor in the latest price-sensitive company announcements or qualitative material. Simply Wall St has no position in any stocks mentioned.