
 Nasdaq
 华尔街日报
华尔街日报Cardinal Infrastructure Group (CDNL): Revisiting Valuation After a 17% One-Day Share Price Jump
Cardinal Infrastructure Group (CDNL) jumped about 17% in the latest session, catching investors attention after a stretch of quiet trading and raising fresh questions about what the market is pricing into this construction contractor.
See our latest analysis for Cardinal Infrastructure Group.
The move takes Cardinal’s share price to about $29.65, and that 17.15% one day share price return builds on a solid 26.17% year to date share price return. This hints that momentum is picking up as investors reassess its risk and growth profile.
If this jump has you wondering what else might be gathering steam, it could be a good moment to scan for auto manufacturers as another way to spot infrastructure linked opportunities in the market.
With Cardinal’s valuation score lagging its price surge and fundamentals still emerging, investors now face a critical question: is this civil contractor quietly trading below its true worth, or is the market already pricing in all the future growth?
Price-to-Earnings of 16.2x: Is it justified?
Cardinal Infrastructure Group trades on a price-to-earnings ratio of 16.2x at its last close of $29.65, a discount to both the broader US market and construction peers, suggesting investors are paying less for each dollar of current earnings.
The price-to-earnings multiple compares the company’s share price to its net profit per share and is a common yardstick for established, profit generating contractors. For a business like Cardinal, with meaningful revenue and earnings already in place, it is a quick way to gauge how the market values today’s profitability relative to other stocks.
At 16.2x, Cardinal changes hands below the US market average of 19.1x. This hints that the market may not be fully crediting its current earnings power. That discount looks even starker against the US construction industry average multiple of 32.3x, which implies investors are pricing Cardinal’s profit stream far more conservatively than many rivals.
See what the numbers say about this price — find out in our valuation breakdown.
Result: Price-to-Earnings of 16.2x (UNDERVALUED)
However, fragile earnings visibility and limited growth data mean that any slowdown in infrastructure spending or project delays could quickly puncture the recent optimism.
Find out about the key risks to this Cardinal Infrastructure Group narrative.
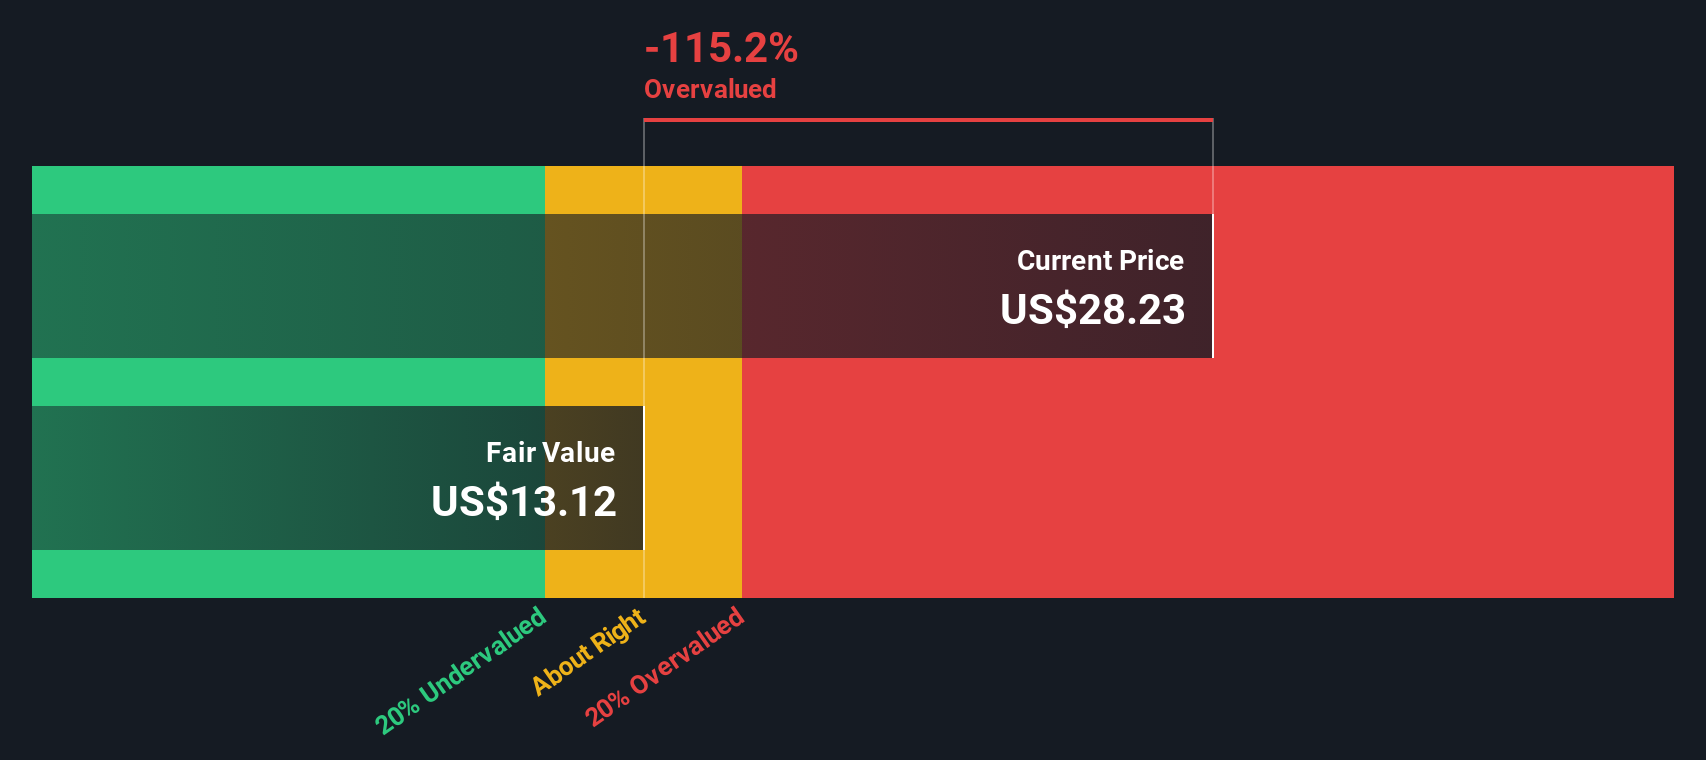
Another View: Our DCF Model Flags Overvaluation
While the earnings multiple makes Cardinal look cheap, our DCF model points the other way. It puts fair value at about $13.15 a share, well below the current $29.65 price, suggesting the stock could be overvalued if cash flows disappoint. Which signal do you trust more?
Look into how the SWS DCF model arrives at its fair value.
Simply Wall St performs a discounted cash flow (DCF) on every stock in the world every day (check out Cardinal Infrastructure Group for example). We show the entire calculation in full. You can track the result in your watchlist or portfolio and be alerted when this changes, or use our stock screener to discover 911 undervalued stocks based on their cash flows. If you save a screener we even alert you when new companies match - so you never miss a potential opportunity.
Build Your Own Cardinal Infrastructure Group Narrative
If you see things differently or want to dig into the numbers yourself, you can build a personalised view in just minutes: Do it your way.
A great starting point for your Cardinal Infrastructure Group research is our analysis highlighting 2 key rewards and 4 important warning signs that could impact your investment decision.
Ready for more high conviction ideas?
Before this opportunity slips past, use the Simply Wall St Screener to uncover fresh stocks that match your strategy, risk appetite, and return expectations.
- Target potential mispricings by reviewing these 911 undervalued stocks based on cash flows that appear cheap relative to their cash flows and fundamentals.
- Ride cutting edge innovation by scanning these 26 AI penny stocks positioned to benefit from rapid advances in artificial intelligence.
- Boost your income potential with these 14 dividend stocks with yields > 3% that may offer attractive yields alongside solid business quality.
This article by Simply Wall St is general in nature. We provide commentary based on historical data and analyst forecasts only using an unbiased methodology and our articles are not intended to be financial advice. It does not constitute a recommendation to buy or sell any stock, and does not take account of your objectives, or your financial situation. We aim to bring you long-term focused analysis driven by fundamental data. Note that our analysis may not factor in the latest price-sensitive company announcements or qualitative material. Simply Wall St has no position in any stocks mentioned.
Have feedback on this article? Concerned about the content? Get in touch with us directly. Alternatively, email editorial-team@simplywallst.com