
 Nasdaq
 华尔街日报
华尔街日报Kesko (HLSE:KESKOB) Valuation Check After November and Year‑to‑Date Sales Growth
Kesko Oyj (HLSE:KESKOB) just reported fresh sales numbers, and they are moving in the right direction. November sales rose 4%, while year to date revenue is up 5%.
See our latest analysis for Kesko Oyj.
The steady sales uptick fits with a share price that has quietly edged higher, with a roughly low single digit year to date share price return and a mid single digit one year total shareholder return hinting at cautiously improving sentiment rather than runaway momentum.
If Kesko’s gradual progress has you thinking about where else steady growth could come from, now might be a good time to discover fast growing stocks with high insider ownership.
With sales momentum building and the share price grinding higher, the key question now is whether Kesko’s solid fundamentals are still underappreciated by the market or if investors have already priced in the next leg of growth.
Price-to-Earnings of 19.4x: Is it justified?
Kesko Oyj currently trades on a price-to-earnings ratio of 19.4 times, which looks comparatively expensive versus both its peers and the broader sector given the last close of €18.53.
The price-to-earnings multiple compares the company’s share price with its earnings per share. It is a straightforward way to gauge how much investors are paying for each euro of current profit. For a mature consumer retailer like Kesko, it is a widely used yardstick because earnings tend to be relatively stable over time.
Against that backdrop, Kesko’s 19.4 times price-to-earnings ratio stands above the 15.3 times average for its peer group. This implies that the market is pricing in stronger or more reliable earnings than many of its closest comparables. Yet, despite earnings being forecast to grow at a respectable double digit pace, return on equity is expected to remain below what many investors consider a high bar, which raises questions about how much further the multiple can stretch.
Compared with the broader European Consumer Retailing industry, where the average price-to-earnings multiple is 18 times, Kesko still trades at a premium. This reinforces the sense that investors are paying up for quality and consistency rather than a clear growth outlier.
See what the numbers say about this price — find out in our valuation breakdown.
Result: Price-to-Earnings of 19.4x (OVERVALUED)
However, a sharp consumer slowdown or margin pressure in its building and technical trade division could quickly challenge the premium multiple that investors now assign.
Find out about the key risks to this Kesko Oyj narrative.
Another View: DCF Points to Deep Value
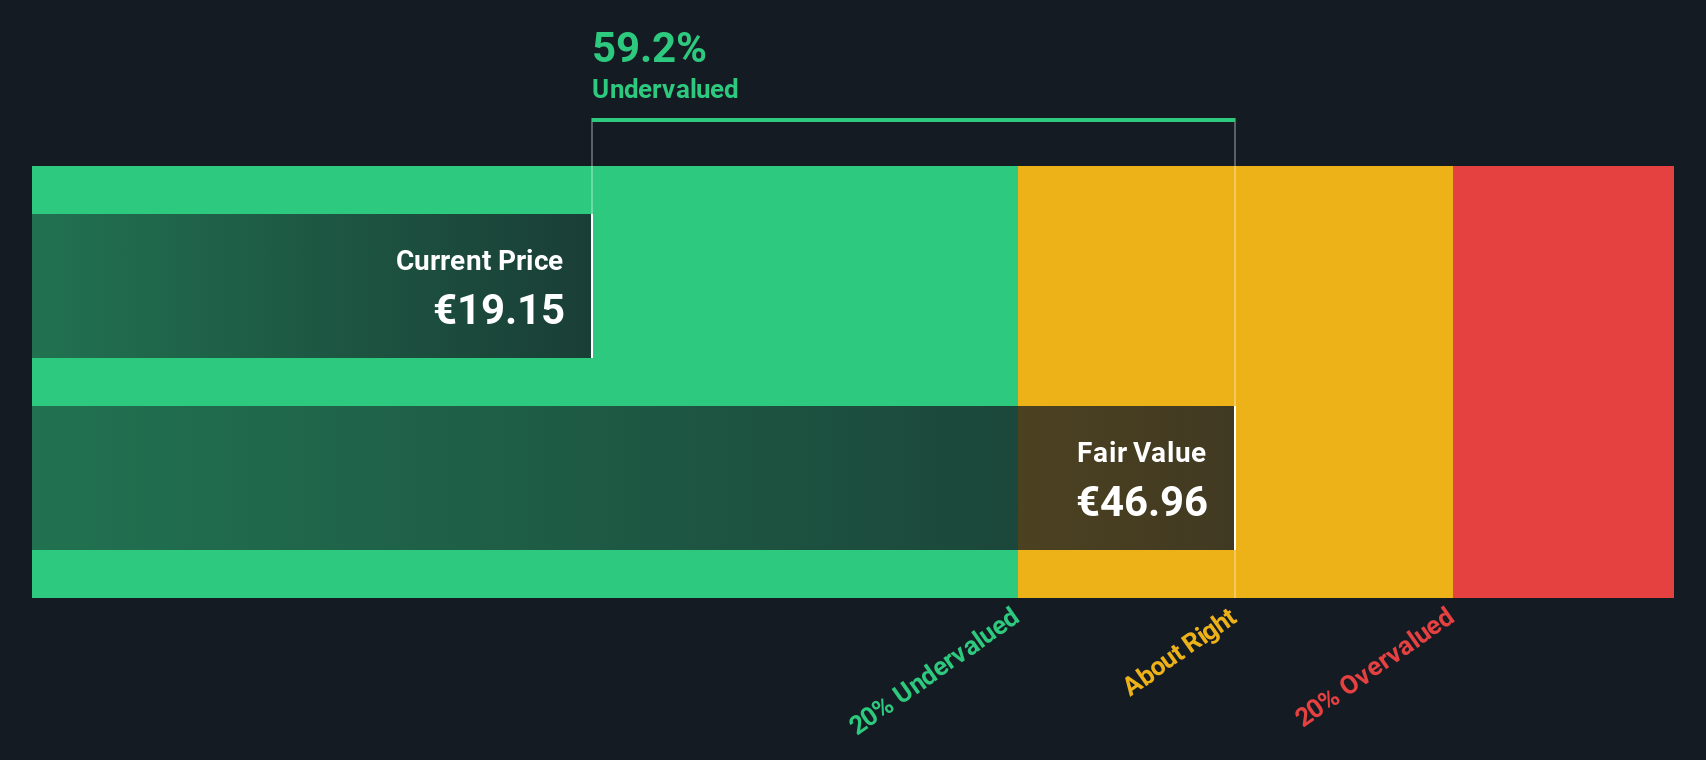
While the 19.4 times earnings multiple makes Kesko look pricey, our DCF model paints a different picture. With fair value estimated at €41 per share, the stock trades at a hefty 54.8% discount, which suggests the market is heavily underpricing its cash flow potential. Could sentiment be too cautious?
Look into how the SWS DCF model arrives at its fair value.
Simply Wall St performs a discounted cash flow (DCF) on every stock in the world every day (check out Kesko Oyj for example). We show the entire calculation in full. You can track the result in your watchlist or portfolio and be alerted when this changes, or use our stock screener to discover 909 undervalued stocks based on their cash flows. If you save a screener we even alert you when new companies match - so you never miss a potential opportunity.
Build Your Own Kesko Oyj Narrative
If you would rather interpret the numbers yourself and challenge these conclusions, you can build a personalised view of Kesko in under three minutes: Do it your way.
A great starting point for your Kesko Oyj research is our analysis highlighting 2 key rewards and 2 important warning signs that could impact your investment decision.
Looking for more investment ideas?
Kesko may be compelling, but you will kick yourself later if you ignore other opportunities that match your style, goals, and risk appetite today.
- Capture potential mispricings by scanning these 909 undervalued stocks based on cash flows that trade below what their cash flows suggest they are worth.
- Position for innovation by targeting these 26 AI penny stocks that could benefit most from the acceleration of artificial intelligence.
- Strengthen your income stream by focusing on these 13 dividend stocks with yields > 3% that balance reliable payouts with solid fundamentals.
This article by Simply Wall St is general in nature. We provide commentary based on historical data and analyst forecasts only using an unbiased methodology and our articles are not intended to be financial advice. It does not constitute a recommendation to buy or sell any stock, and does not take account of your objectives, or your financial situation. We aim to bring you long-term focused analysis driven by fundamental data. Note that our analysis may not factor in the latest price-sensitive company announcements or qualitative material. Simply Wall St has no position in any stocks mentioned.
Have feedback on this article? Concerned about the content? Get in touch with us directly. Alternatively, email editorial-team@simplywallst.com