
 Nasdaq
 华尔街日报
华尔街日报Is SCR-Sibelco (ENXTBR:094426466) Overvalued After Its Quiet One-Year Rebound? A Closer Look at the P/E and DCF
SCR-Sibelco (ENXTBR:094426466) has quietly outperformed over the past year, even as returns were mixed in the past 3 years and 5 years. This makes the current share price worth a closer look.
See our latest analysis for SCR-Sibelco.
With the share price now at $4,700 and a modest 1 month share price return of 1.73 percent, the real story is the 1 year total shareholder return of 9.3 percent, which suggests momentum is quietly rebuilding after a tougher multi year patch.
If SCR-Sibelco’s steady climb has you thinking about what else could be compounding in the background, it is a good moment to explore fast growing stocks with high insider ownership.
Given SCR-Sibelco’s mixed long term track record and recent uptick, the key question is whether the current valuation still underestimates its earnings power, or if the market is already pricing in any future growth?
Price-to-Earnings of 25.6x: Is it justified?
SCR-Sibelco trades on a price-to-earnings ratio of 25.6x, which looks demanding when set against the €4,700 last close and weaker recent profit trends.
The price-to-earnings (P E) ratio compares the current share price to earnings per share. It is often used as a key yardstick for mature, profitable industrial and materials businesses where earnings are a primary driver of long term value.
In this case, a 25.6x multiple implies that investors are willing to pay a high price for each unit of current earnings, even though the company has seen negative earnings growth of 67.6 percent over the past year and margins have compressed from 9.2 percent to 2.8 percent. This raises questions about how much future profit recovery is already embedded in the valuation.
Relative to the European Metals and Mining industry average price-to-earnings ratio of 16.2x and an even lower peer group average of 12.8x, SCR-Sibelco looks significantly more expensive. This suggests the market is attaching a premium that peers do not enjoy and that may need to be justified by either a sharper earnings rebound or a structurally stronger business profile.
See what the numbers say about this price — find out in our valuation breakdown.
Result: Price-to-Earnings of 25.6x (OVERVALUED)
However, sustained margin pressure and any prolonged weakness in global industrial demand could quickly challenge the premium valuation that investors are currently paying.
Find out about the key risks to this SCR-Sibelco narrative.
Another View: DCF Signals Even Richer Pricing
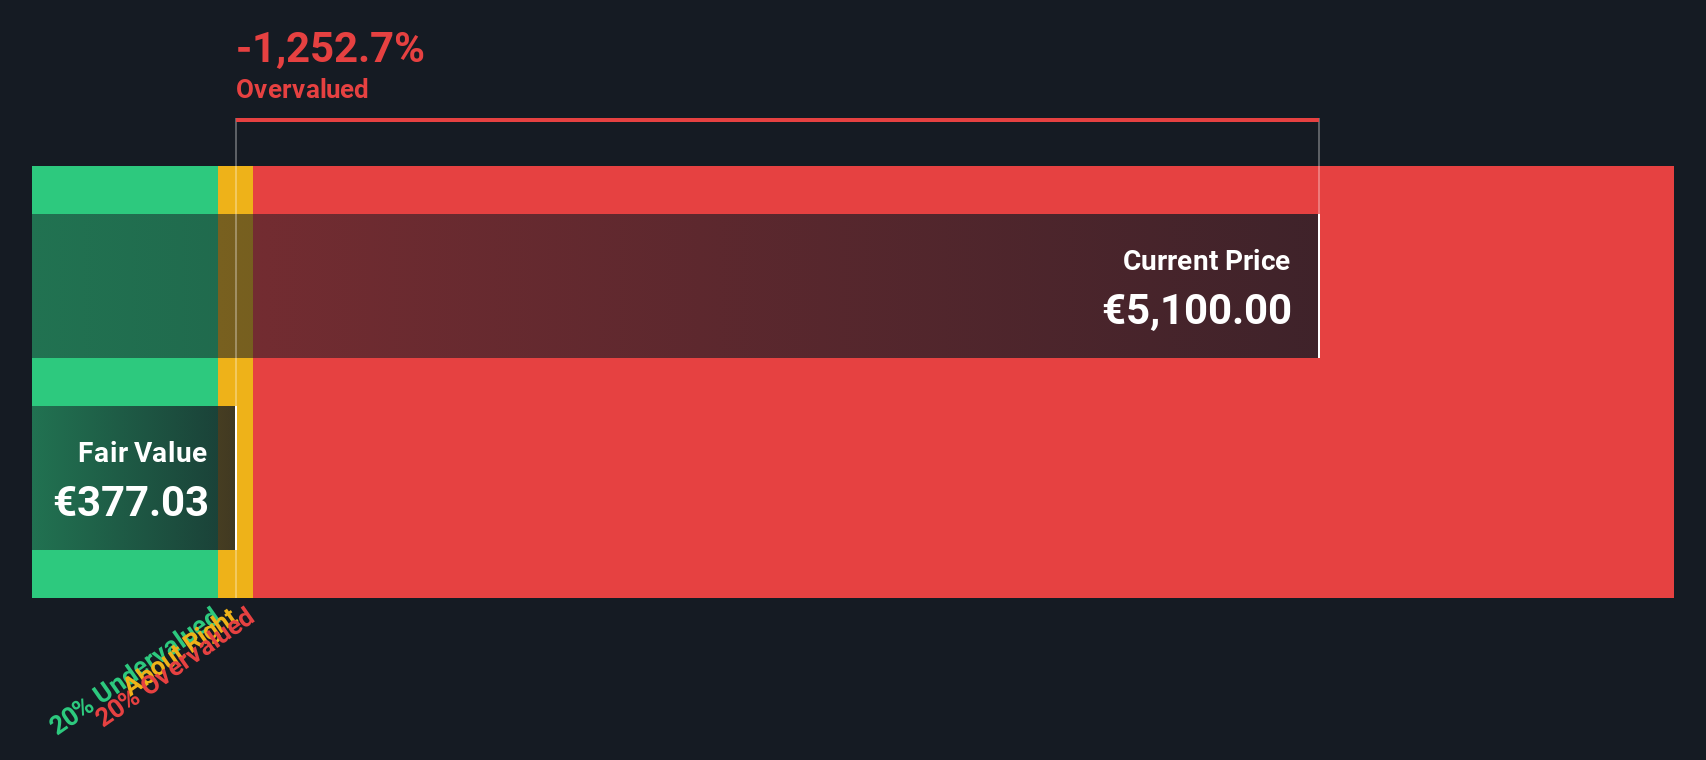
While the 25.6x earnings multiple already looks demanding, our DCF model paints an even starker picture, suggesting fair value closer to €376.71, far below the €4,700 share price. If both methods lean to overvaluation, what catalyst is the market really betting on?
Look into how the SWS DCF model arrives at its fair value.
Simply Wall St performs a discounted cash flow (DCF) on every stock in the world every day (check out SCR-Sibelco for example). We show the entire calculation in full. You can track the result in your watchlist or portfolio and be alerted when this changes, or use our stock screener to discover 901 undervalued stocks based on their cash flows. If you save a screener we even alert you when new companies match - so you never miss a potential opportunity.
Build Your Own SCR-Sibelco Narrative
If you see the numbers differently or prefer hands on research, you can build your own view in minutes with Do it your way.
A great starting point for your SCR-Sibelco research is our analysis highlighting 3 important warning signs that could impact your investment decision.
Looking for more investment ideas?
Smart investors never stop building their opportunity set, and the Simply Wall St Screener helps you pinpoint fresh ideas before the crowd catches on.
- Capture potential cash flow upside by scanning these 901 undervalued stocks based on cash flows that the market may be mispricing today.
- Explore the next wave of innovation by targeting these 26 AI penny stocks positioned at the core of the AI transformation.
- Seek income potential with these 13 dividend stocks with yields > 3% that can contribute to total returns through consistent payouts.
This article by Simply Wall St is general in nature. We provide commentary based on historical data and analyst forecasts only using an unbiased methodology and our articles are not intended to be financial advice. It does not constitute a recommendation to buy or sell any stock, and does not take account of your objectives, or your financial situation. We aim to bring you long-term focused analysis driven by fundamental data. Note that our analysis may not factor in the latest price-sensitive company announcements or qualitative material. Simply Wall St has no position in any stocks mentioned.
Have feedback on this article? Concerned about the content? Get in touch with us directly. Alternatively, email editorial-team@simplywallst.com