
 Nasdaq
 华尔街日报
华尔街日报Kadant (NYSE:KAI) Has A Pretty Healthy Balance Sheet
Howard Marks put it nicely when he said that, rather than worrying about share price volatility, 'The possibility of permanent loss is the risk I worry about... and every practical investor I know worries about.' When we think about how risky a company is, we always like to look at its use of debt, since debt overload can lead to ruin. Importantly, Kadant Inc. (NYSE:KAI) does carry debt. But the real question is whether this debt is making the company risky.
Why Does Debt Bring Risk?
Debt assists a business until the business has trouble paying it off, either with new capital or with free cash flow. If things get really bad, the lenders can take control of the business. However, a more common (but still painful) scenario is that it has to raise new equity capital at a low price, thus permanently diluting shareholders. By replacing dilution, though, debt can be an extremely good tool for businesses that need capital to invest in growth at high rates of return. When we examine debt levels, we first consider both cash and debt levels, together.
What Is Kadant's Net Debt?
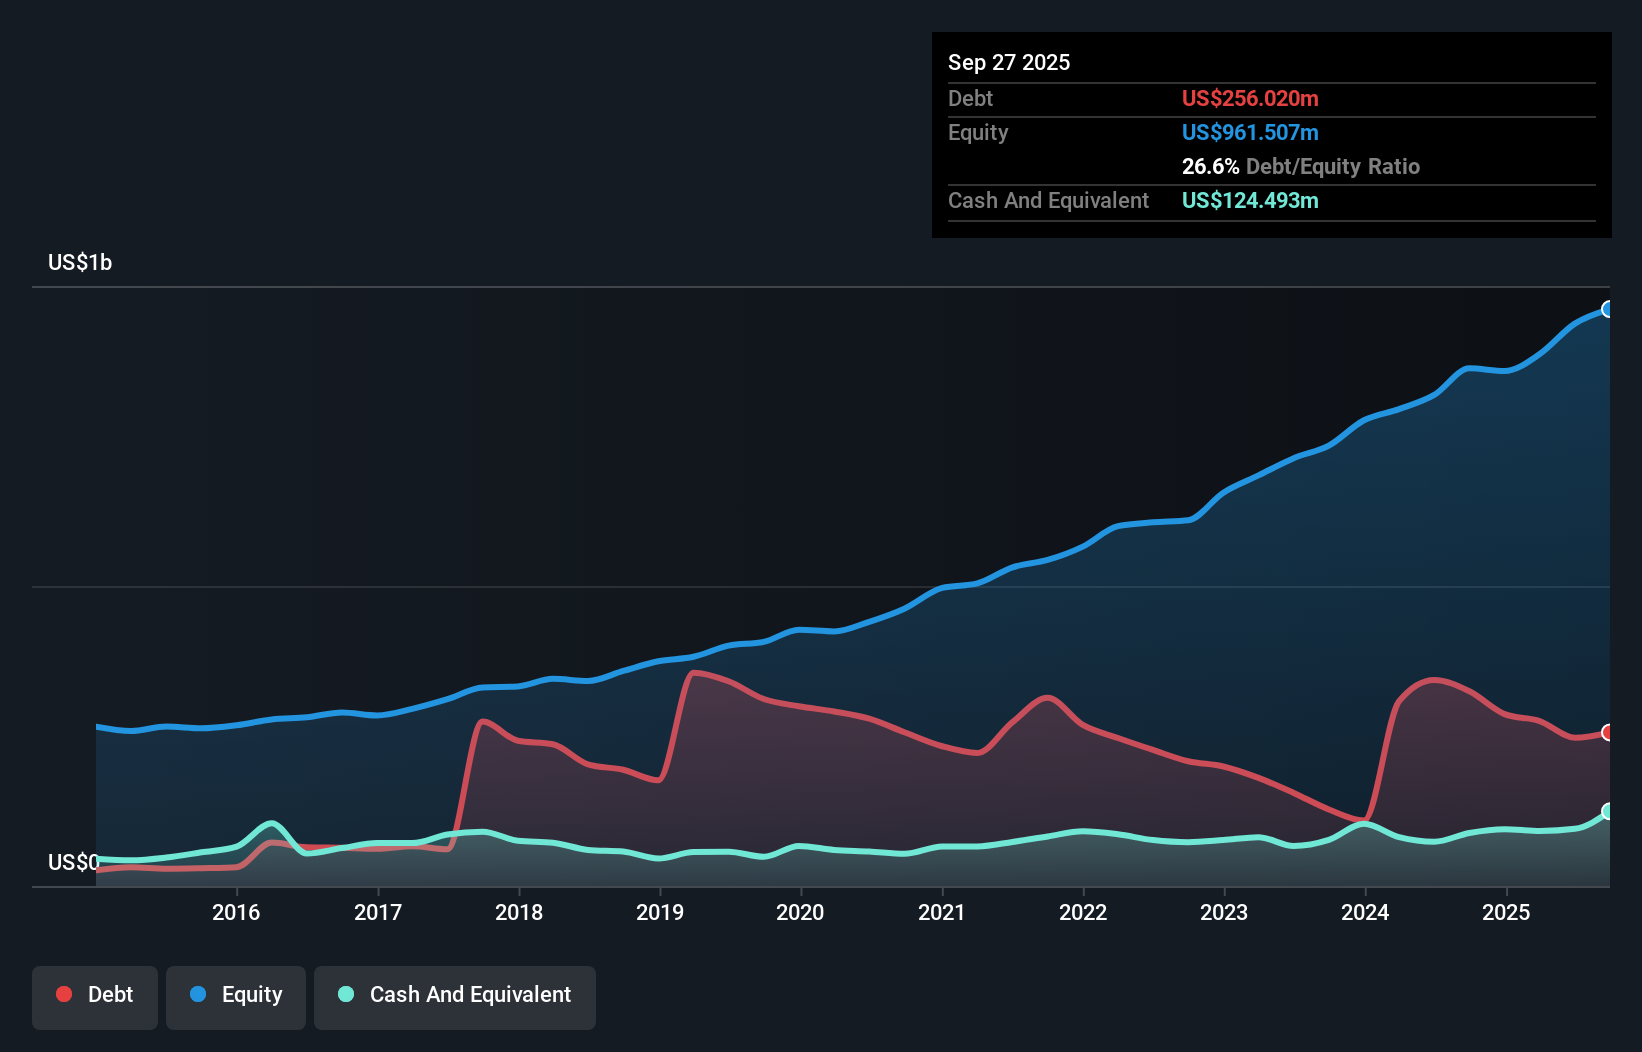
As you can see below, Kadant had US$256.0m of debt at September 2025, down from US$324.5m a year prior. On the flip side, it has US$124.5m in cash leading to net debt of about US$131.5m.
A Look At Kadant's Liabilities
According to the last reported balance sheet, Kadant had liabilities of US$212.5m due within 12 months, and liabilities of US$358.2m due beyond 12 months. Offsetting this, it had US$124.5m in cash and US$182.2m in receivables that were due within 12 months. So its liabilities outweigh the sum of its cash and (near-term) receivables by US$264.0m.
Of course, Kadant has a market capitalization of US$3.44b, so these liabilities are probably manageable. Having said that, it's clear that we should continue to monitor its balance sheet, lest it change for the worse.
Check out our latest analysis for Kadant
We measure a company's debt load relative to its earnings power by looking at its net debt divided by its earnings before interest, tax, depreciation, and amortization (EBITDA) and by calculating how easily its earnings before interest and tax (EBIT) cover its interest expense (interest cover). This way, we consider both the absolute quantum of the debt, as well as the interest rates paid on it.
Kadant has a low net debt to EBITDA ratio of only 0.62. And its EBIT easily covers its interest expense, being 12.3 times the size. So we're pretty relaxed about its super-conservative use of debt. On the other hand, Kadant's EBIT dived 11%, over the last year. If that rate of decline in earnings continues, the company could find itself in a tight spot. When analysing debt levels, the balance sheet is the obvious place to start. But it is future earnings, more than anything, that will determine Kadant's ability to maintain a healthy balance sheet going forward. So if you're focused on the future you can check out this free report showing analyst profit forecasts.
Finally, a company can only pay off debt with cold hard cash, not accounting profits. So it's worth checking how much of that EBIT is backed by free cash flow. Over the most recent three years, Kadant recorded free cash flow worth 76% of its EBIT, which is around normal, given free cash flow excludes interest and tax. This cold hard cash means it can reduce its debt when it wants to.
Our View
Kadant's interest cover suggests it can handle its debt as easily as Cristiano Ronaldo could score a goal against an under 14's goalkeeper. But the stark truth is that we are concerned by its EBIT growth rate. When we consider the range of factors above, it looks like Kadant is pretty sensible with its use of debt. While that brings some risk, it can also enhance returns for shareholders. When analysing debt levels, the balance sheet is the obvious place to start. However, not all investment risk resides within the balance sheet - far from it. Be aware that Kadant is showing 1 warning sign in our investment analysis , you should know about...
At the end of the day, it's often better to focus on companies that are free from net debt. You can access our special list of such companies (all with a track record of profit growth). It's free.
Have feedback on this article? Concerned about the content? Get in touch with us directly. Alternatively, email editorial-team (at) simplywallst.com.
This article by Simply Wall St is general in nature. We provide commentary based on historical data and analyst forecasts only using an unbiased methodology and our articles are not intended to be financial advice. It does not constitute a recommendation to buy or sell any stock, and does not take account of your objectives, or your financial situation. We aim to bring you long-term focused analysis driven by fundamental data. Note that our analysis may not factor in the latest price-sensitive company announcements or qualitative material. Simply Wall St has no position in any stocks mentioned.