
 Nasdaq
 华尔街日报
华尔街日报Does Microsoft Still Offer Upside After AI Investment Push and Recent Share Price Pullback?
- If you are wondering whether Microsoft is still worth considering after its strong run over the last few years, or if most of the potential upside is already priced in, this article is for you.
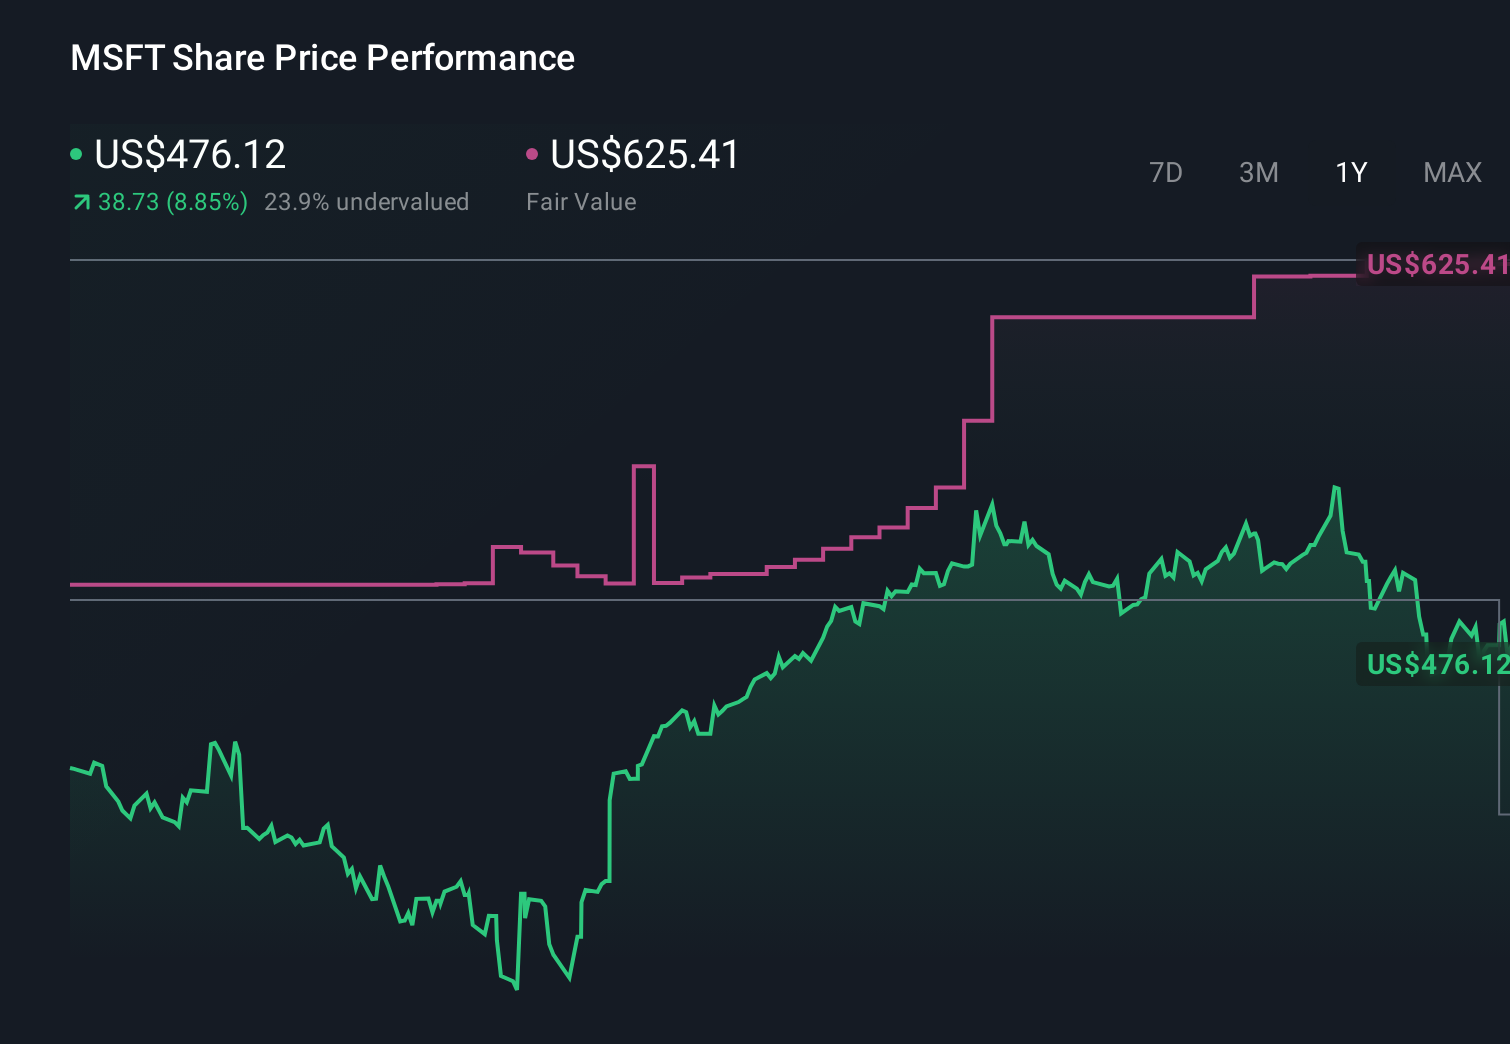
- Despite a strong longer term track record, with the share price up 100.2% over 3 years and 128.1% over 5 years, the stock has cooled recently, slipping 1.0% over the past week and 6.2% over the last month. It still sits 14.3% higher year to date and 7.8% above where it was a year ago.
- Recent headlines have focused on Microsoft increasing its investment in AI infrastructure and cloud partnerships, reinforcing the narrative that it sits at the center of the next wave of enterprise software demand. At the same time, ongoing regulatory scrutiny of its acquisitions and partnerships has added a layer of uncertainty that helps explain some of the recent share price swings.
- On our framework the stock currently scores a 4 out of 6 valuation checks, suggesting it appears undervalued on several metrics even after its multi year rally. Next, we will unpack what different valuation approaches indicate about Microsoft today, and later in the article we will explore a more nuanced way of thinking about its value beyond the usual ratios.
Approach 1: Microsoft Discounted Cash Flow (DCF) Analysis
A Discounted Cash Flow model estimates what a company is worth by projecting its future cash flows and then discounting them back to today in $ terms. For Microsoft, this 2 stage Free Cash Flow to Equity model starts from last twelve months free cash flow of about $89.4 billion and uses analyst forecasts for the next several years, with Simply Wall St extrapolating growth further out.
Under this framework, Microsoft’s free cash flow is projected to rise to roughly $369.8 billion by 2035, with intermediate projections such as about $206.2 billion by 2030. Those future $ cash flows are then discounted back to their present value, reflecting the risk and time value of money.
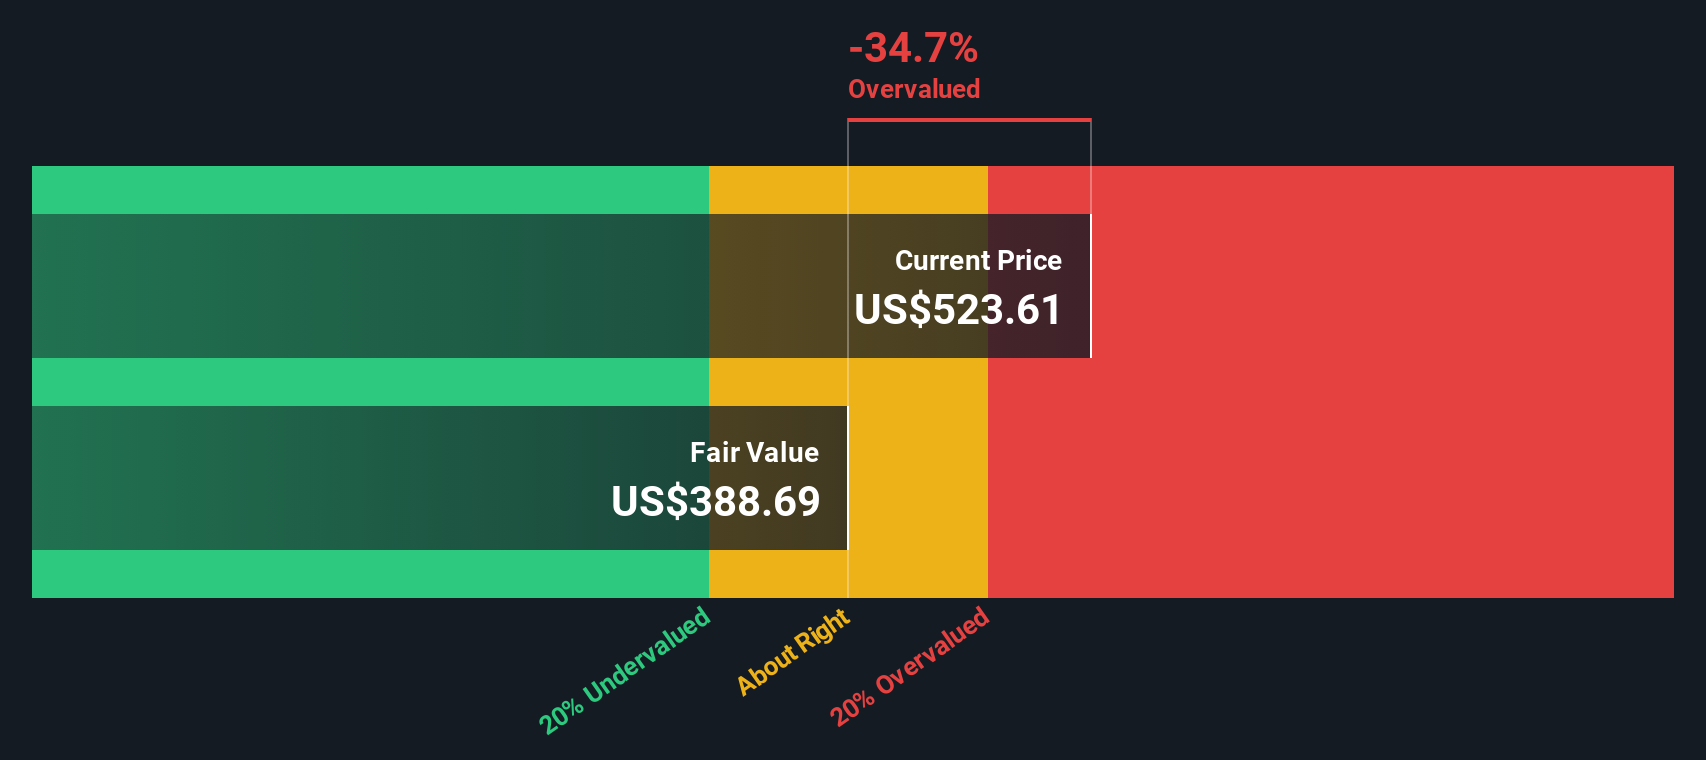
Putting it all together, the model arrives at an estimated intrinsic value of around $602.49 per share, which implies the stock is trading at roughly a 20.6% discount to fair value. On this basis, the DCF suggests Microsoft’s current share price leaves a meaningful margin of safety.
Result: UNDERVALUED
Our Discounted Cash Flow (DCF) analysis suggests Microsoft is undervalued by 20.6%. Track this in your watchlist or portfolio, or discover 908 more undervalued stocks based on cash flows.
Approach 2: Microsoft Price vs Earnings
For established, profitable businesses like Microsoft, the price to earnings ratio is often the most intuitive way to think about valuation because it directly links what investors pay today to the company’s current earnings power.
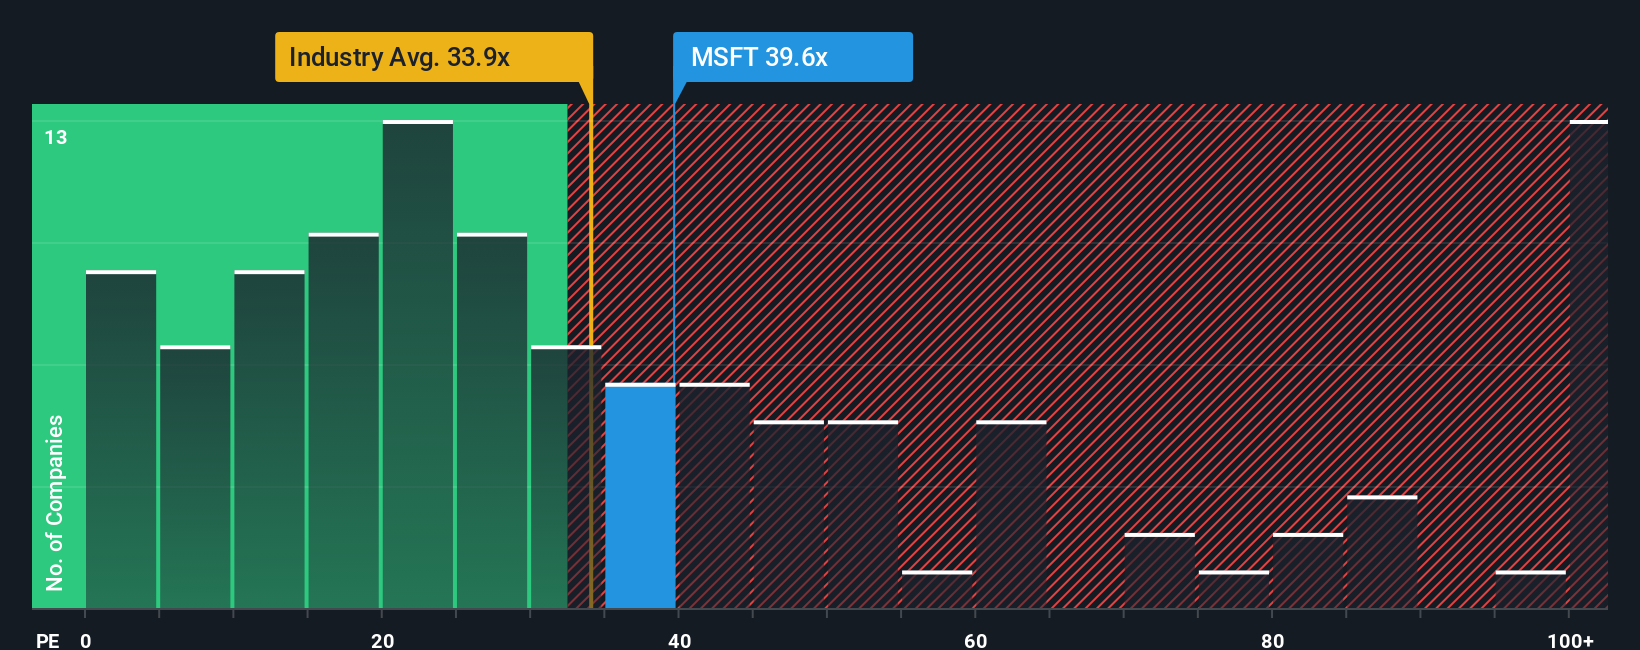
In simple terms, higher expected growth and lower perceived risk generally justify a higher, or more generous, PE ratio, while slower growth or higher uncertainty usually warrant a lower multiple. Microsoft currently trades on about 33.9x earnings, slightly above the broader Software industry average of roughly 32.9x and close to its peer group average of about 32.5x.
Simply Wall St’s Fair Ratio framework goes a step further than these simple comparisons by estimating what PE multiple Microsoft should trade on, given its earnings growth outlook, profitability, size, industry and risk profile. For Microsoft, this Fair Ratio is calculated at around 52.7x, implying that, relative to its fundamentals, the current 33.9x multiple looks conservative rather than stretched.
On this basis, Microsoft appears undervalued when judged against its Fair Ratio, even if it looks only modestly expensive versus peers.
Result: UNDERVALUED
PE ratios tell one story, but what if the real opportunity lies elsewhere? Discover 1444 companies where insiders are betting big on explosive growth.
Upgrade Your Decision Making: Choose your Microsoft Narrative
Earlier we mentioned that there is an even better way to understand valuation, so let us introduce you to Narratives, a simple framework that lets you turn your view of Microsoft into a clear story that connects what you believe about its future to a set of forecasts, and finally to a Fair Value you can compare to today’s price.
A Narrative is your story behind the numbers, where you spell out what you expect for revenue growth, margins and risks. The platform then turns that into a financial forecast and Fair Value estimate, all within the Simply Wall St Community page that millions of investors already use.
Because Narratives live on the platform, they update dynamically as new information arrives. When earnings, news or guidance change the outlook for Microsoft, you can immediately see how that affects your Fair Value and whether the gap to the current share price suggests a buy, hold or sell.
For example, one conservative Microsoft Narrative on the Community might assume heavy AI spending, slowing growth and a Fair Value near $360. A more optimistic Narrative could factor in sustained double digit cloud and AI growth and arrive at a Fair Value close to $625, showing how two reasonable stories can lead to very different decisions.
For Microsoft however we will make it really easy for you with previews of two leading Microsoft Narratives:
Fair value: $625.41
Implied undervaluation vs current price: 23.6%
Revenue growth assumption: 15.28%
- Views accelerating AI and cloud integration, plus a sticky subscription model, as drivers of durable high margin growth and predictable earnings.
- Expects expanding Azure, security, and backlog to support rising free cash flow and slightly improving profit margins despite elevated AI CapEx.
- Aligns broadly with analyst consensus that Microsoft can sustain double digit revenue and earnings growth, which some investors see as justifying a premium multiple and potential upside to around the low $600s.
Fair value: $420.00
Implied overvaluation vs current price: 14.0%
Revenue growth assumption: -0.78%
- Argues that AI hype has pushed valuation too far given headwinds from a shrinking PC market, weak Xbox hardware position, and deteriorating Windows user experience.
- Warns that massive AI data center CapEx could erode Microsoft’s traditional software like margins if AI models commoditize and pricing power fades.
- Highlights structural risks that AI may cannibalize per seat Office revenue and that weakening consumer and developer affinity could ultimately undermine Azure and enterprise dominance.
Do you think there's more to the story for Microsoft? Head over to our Community to see what others are saying!
This article by Simply Wall St is general in nature. We provide commentary based on historical data and analyst forecasts only using an unbiased methodology and our articles are not intended to be financial advice. It does not constitute a recommendation to buy or sell any stock, and does not take account of your objectives, or your financial situation. We aim to bring you long-term focused analysis driven by fundamental data. Note that our analysis may not factor in the latest price-sensitive company announcements or qualitative material. Simply Wall St has no position in any stocks mentioned.
Have feedback on this article? Concerned about the content? Get in touch with us directly. Alternatively, email editorial-team@simplywallst.com