
 Nasdaq
 华尔街日报
华尔街日报Is Tyler Technologies Still Worth Its Premium After a 21% Slide in 2025?
- If you are wondering whether Tyler Technologies is still worth its premium price tag or if the recent pullback is opening up a genuine opportunity, this breakdown will help you figure out whether the current share price makes sense.
- The stock is down about 2.9% over the last week, 2.6% over the last month, and roughly 20.7% year to date. This extends a 25.5% slide over the past year, although it remains up 42.3% over three years.
- Much of this cooling off has come after a strong multi year run in which optimism around digital government software, cloud adoption, and Tyler's role in modernizing public sector IT pushed expectations high. More recently, investors have been recalibrating what they are willing to pay for growth and quality in software names like Tyler amid shifting interest rate and risk sentiment.
- Right now, Tyler Technologies scores just 2/6 on our valuation checks, which suggests the market may still be pricing in a lot of optimism. In the sections that follow, we will walk through the main valuation methods, and then finish with a more holistic way to decide what the stock is really worth to you.
Tyler Technologies scores just 2/6 on our valuation checks. See what other red flags we found in the full valuation breakdown.
Approach 1: Tyler Technologies Discounted Cash Flow (DCF) Analysis
A Discounted Cash Flow model estimates what a business is worth by projecting the cash it can generate in the future and then discounting those projections back to today in dollar terms.
For Tyler Technologies, the latest twelve month Free Cash Flow is about $584.8 million. Analysts expect this to continue growing, with Simply Wall St using a 2 Stage Free Cash Flow to Equity model. Their projections see Free Cash Flow rising towards around $1.0 billion by 2029, with further years extrapolated beyond the formal analyst horizon to capture a full decade of cash generation.
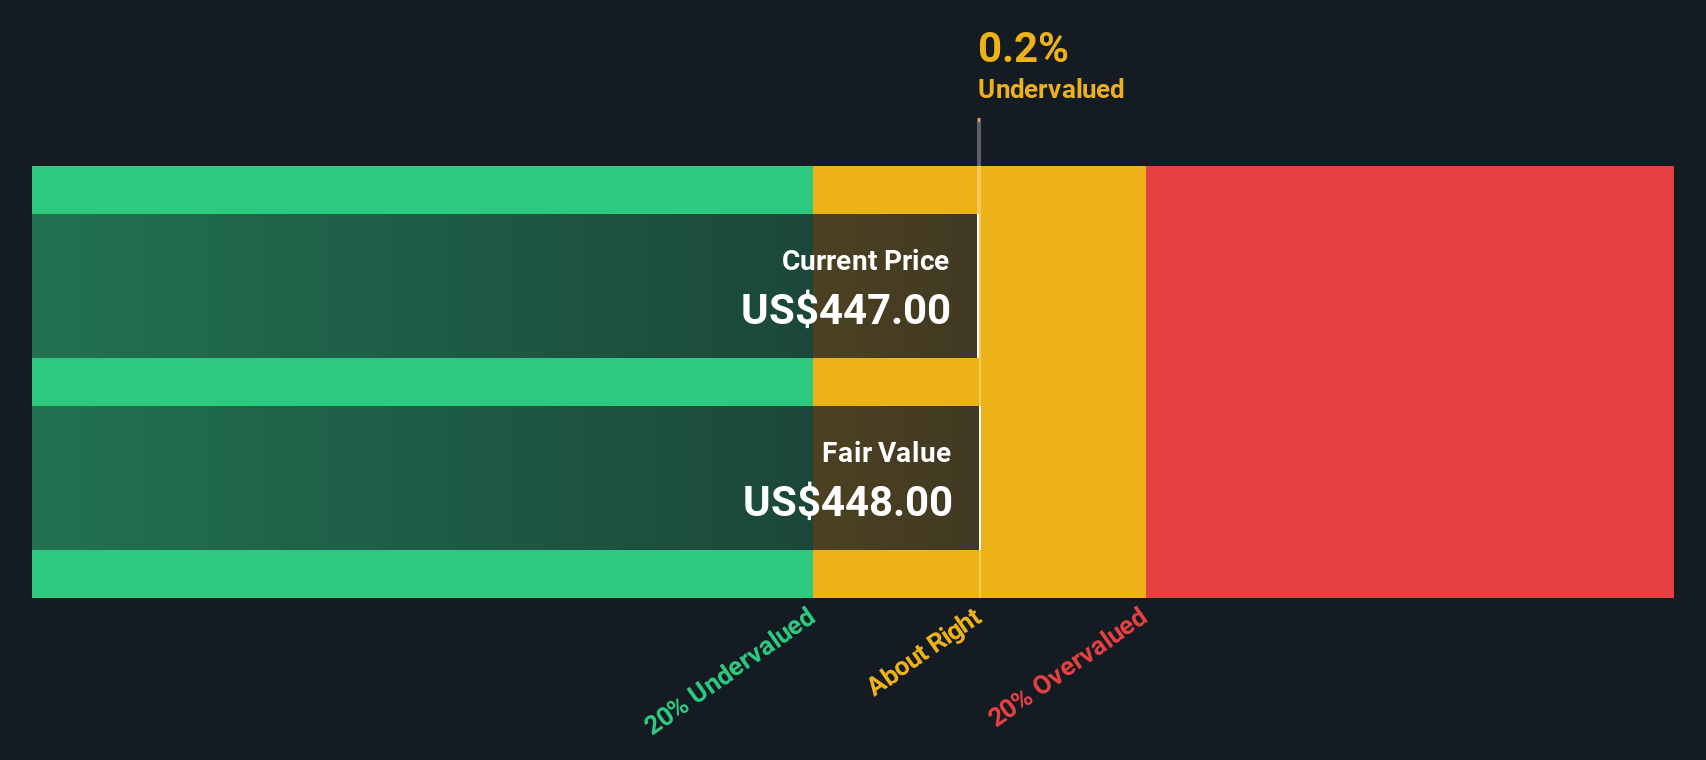
Putting all those future cash flows together and discounting them back to today gives an estimated intrinsic value of roughly $447.60 per share. That is only about 1.8% above the current share price, which implies the stock is slightly overvalued but effectively in line with its modeled fair value.
Result: ABOUT RIGHT
Tyler Technologies is fairly valued according to our Discounted Cash Flow (DCF), but this can change at a moment's notice. Track the value in your watchlist or portfolio and be alerted on when to act.
Approach 2: Tyler Technologies Price vs Earnings
For a profitable software business like Tyler Technologies, the Price to Earnings (PE) ratio is a natural way to think about valuation, because it connects what investors are paying today with the company’s current earnings power. In general, faster and more predictable earnings growth, with lower risk, should justify a higher PE multiple, while slower or more volatile growth should command a lower one.
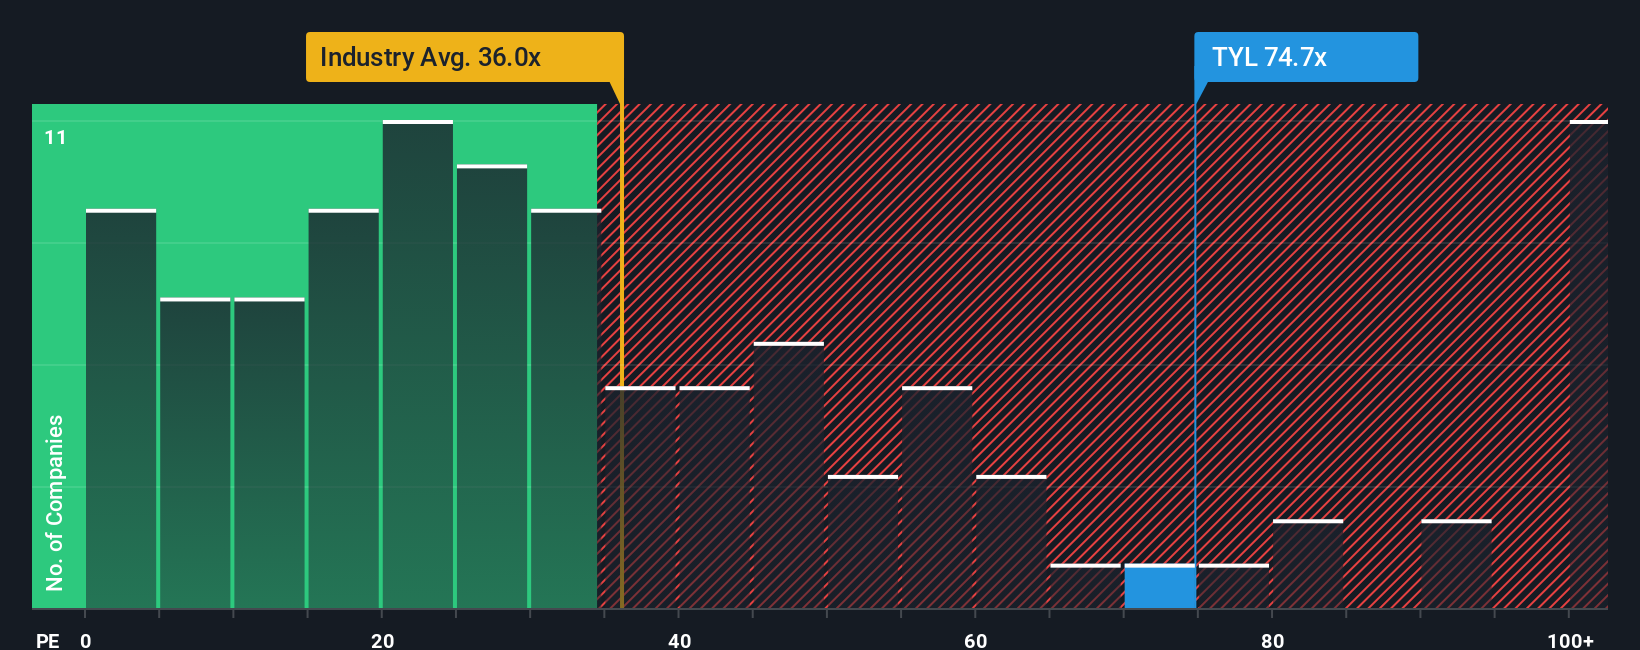
Tyler currently trades on a PE of about 62.2x, which is nearly double the broader Software industry average of around 32.9x, and still a discount to the peer group average of about 70.5x. Simply Wall St’s proprietary “Fair Ratio” model, which estimates what a reasonable PE should be after accounting for factors like Tyler’s earnings growth outlook, profitability, industry, market cap and specific risks, puts that fair PE closer to 32.8x.
This Fair Ratio approach is more tailored than simple peer or industry comparisons, because it blends Tyler’s fundamentals with its risk and growth profile rather than assuming all software names deserve the same multiple. Comparing the Fair Ratio of 32.8x with the current 62.2x suggests the shares are trading at a substantial premium to what those fundamentals justify.
Result: OVERVALUED
PE ratios tell one story, but what if the real opportunity lies elsewhere? Discover 1445 companies where insiders are betting big on explosive growth.
Upgrade Your Decision Making: Choose your Tyler Technologies Narrative
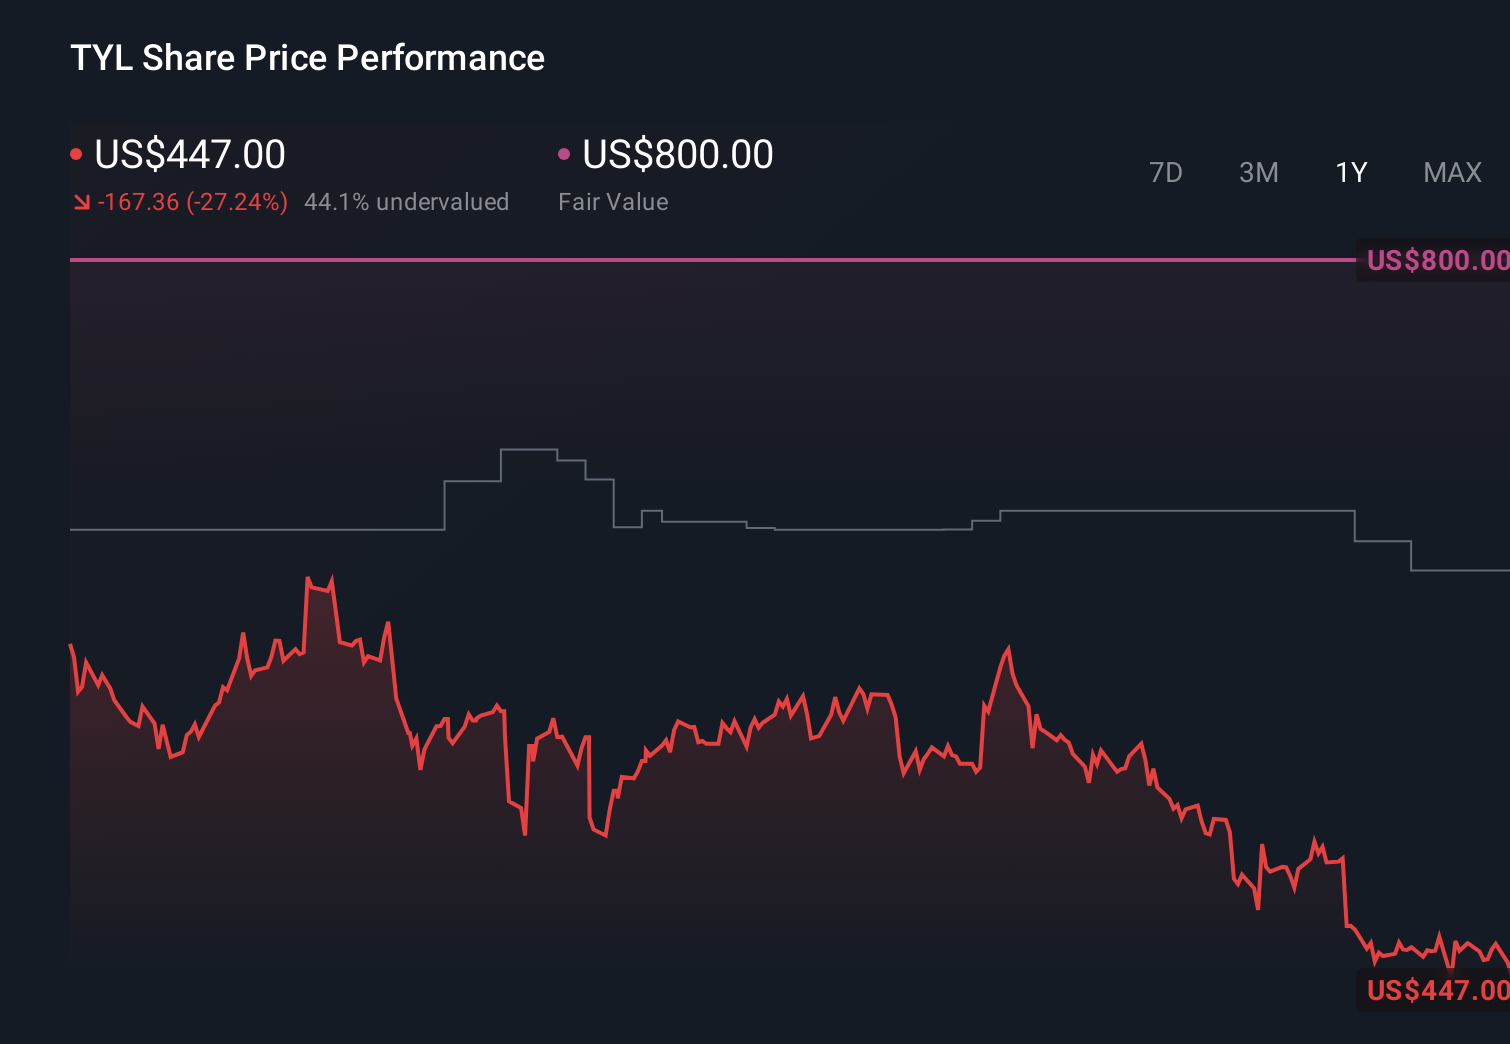
Earlier we mentioned that there is an even better way to understand valuation, so let us introduce you to Narratives, a simple way to attach a clear story to your numbers by linking your view of Tyler Technologies' future revenue, earnings and margins to a financial forecast and a fair value estimate that you can easily compare with today’s share price. On Simply Wall St’s Community page, used by millions of investors, Narratives let you set assumptions that reflect your own perspective, and then automatically translate them into a dynamic valuation that updates when new information like earnings, guidance or news arrives. This can make it much easier to decide whether to buy or sell, because you can see at a glance whether your Narrative Fair Value is above or below the current market price, and by how much. For example, one investor might build a very optimistic Tyler Technologies Narrative with strong SaaS growth and a fair value near $800, while a more cautious investor might assume slower adoption and price in more risk, ending up closer to $585. Both investors can then track how their stories evolve as fresh data comes in.
Do you think there's more to the story for Tyler Technologies? Head over to our Community to see what others are saying!
This article by Simply Wall St is general in nature. We provide commentary based on historical data and analyst forecasts only using an unbiased methodology and our articles are not intended to be financial advice. It does not constitute a recommendation to buy or sell any stock, and does not take account of your objectives, or your financial situation. We aim to bring you long-term focused analysis driven by fundamental data. Note that our analysis may not factor in the latest price-sensitive company announcements or qualitative material. Simply Wall St has no position in any stocks mentioned.
Have feedback on this article? Concerned about the content? Get in touch with us directly. Alternatively, email editorial-team@simplywallst.com