
 Nasdaq
 华尔街日报
华尔街日报Has Shake Shack’s Share Price Slide Created a New Opportunity for Investors?
- Wondering if Shake Shack at around $83 a share is a bargain or a value trap? You are not alone, and this is exactly the kind of stock where a closer look at valuation really matters.
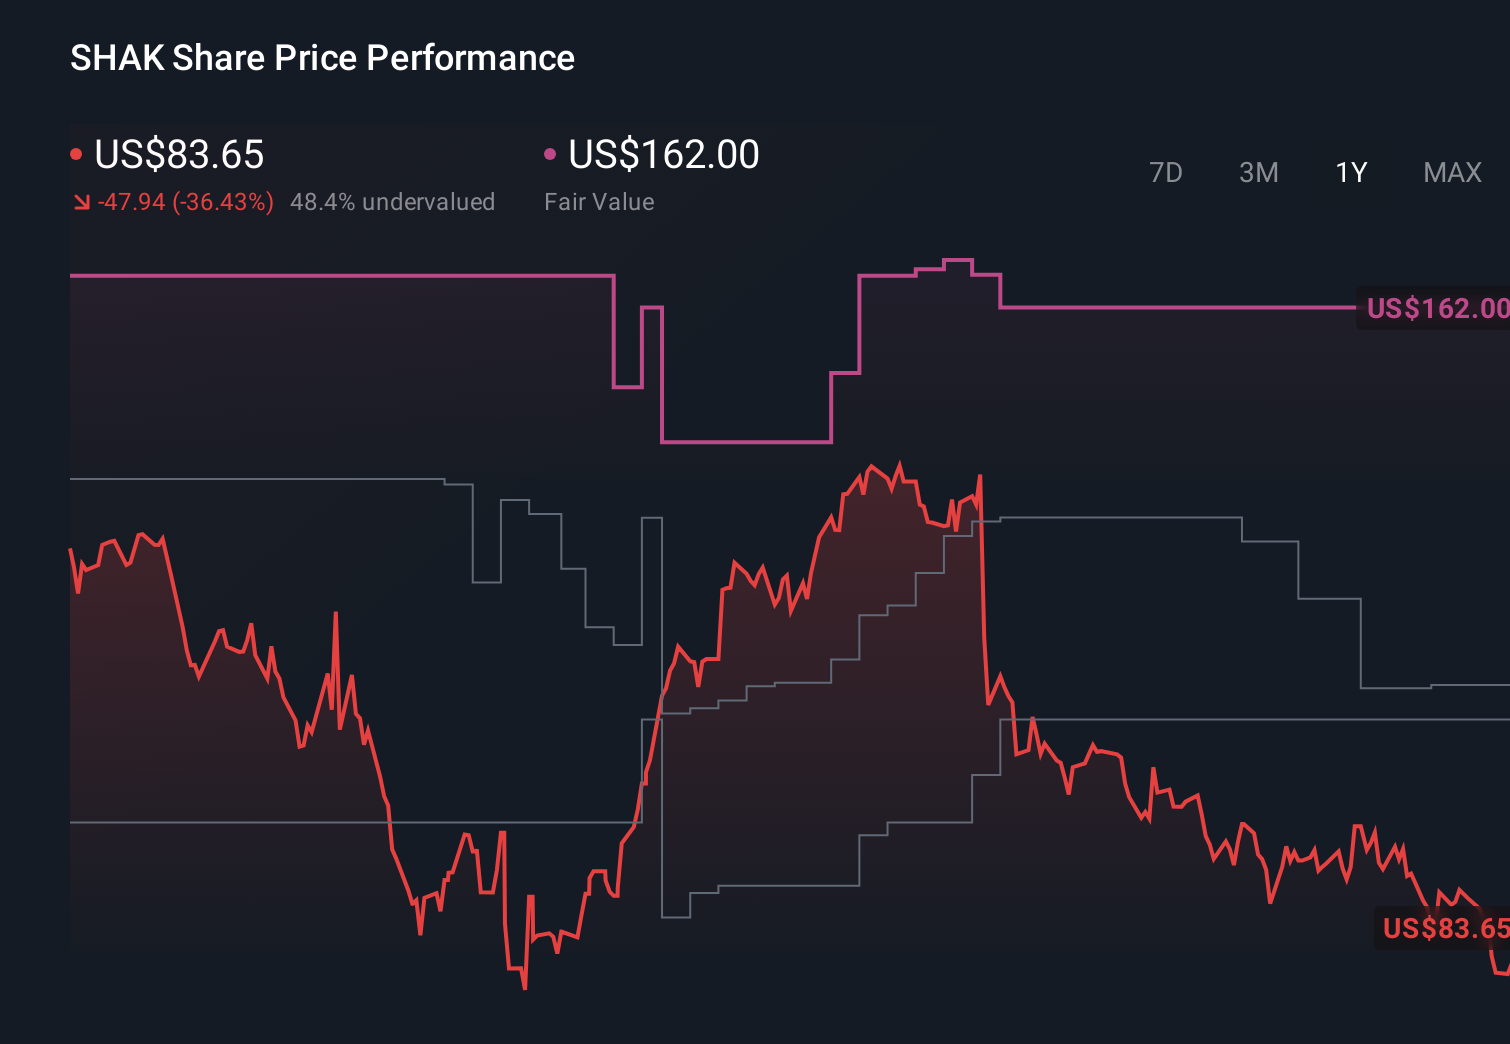
- The share price has bounced 6.6% over the last week but is still down 8.2% over 30 days, 37.6% year to date and 36.8% over the past year, a volatile mix that hints at shifting views on its growth runway and risk profile.
- Investors have been reacting to a steady stream of store expansion updates and management commentary around digital, off premise and international growth, which together paint a picture of a brand still investing heavily in its future. At the same time, debates over whether fast casual demand can keep pace with that expansion have kept sentiment choppy, helping to explain the stock's sharp drawdowns despite a 71.6% gain over three years.
- Right now Shake Shack scores just 0/6 on our valuation checks, suggesting it does not screen as obviously undervalued on the standard metrics we track, but those headline numbers only tell part of the story. Next we will walk through the main valuation approaches investors are using for Shake Shack, and then circle back to a more nuanced way of thinking about what the market might really be pricing in.
Shake Shack scores just 0/6 on our valuation checks. See what other red flags we found in the full valuation breakdown.
Approach 1: Shake Shack Discounted Cash Flow (DCF) Analysis
A Discounted Cash Flow, or DCF, model estimates what a business is worth today by projecting the cash it could generate in the future and then discounting those cash flows back to the present. For Shake Shack, the model used is a 2 Stage Free Cash Flow to Equity approach based on cash flow projections.
Shake Shack currently generates about $38.9 Million in free cash flow, and analysts expect this to grow steadily as new locations ramp up and existing restaurants mature. Simply Wall St has combined analyst estimates for the next few years with longer term extrapolations, arriving at projected free cash flow of roughly $122.6 Million by 2035, all expressed in $ and then discounted back to today.
Aggregating these discounted cash flows produces an estimated intrinsic value of about $35.56 per share, which implies the stock is roughly 133.9% overvalued versus the recent market price around $83. On this cash flow view, investors are paying far ahead of the current growth trajectory.
Result: OVERVALUED
Our Discounted Cash Flow (DCF) analysis suggests Shake Shack may be overvalued by 133.9%. Discover 908 undervalued stocks or create your own screener to find better value opportunities.
Approach 2: Shake Shack Price vs Earnings
For a business that is generating profits, the price to earnings, or PE, ratio is often the most intuitive way to think about valuation because it links what investors are paying directly to the company’s bottom line. What counts as a reasonable PE depends on how quickly earnings are expected to grow and how risky or cyclical those earnings are, with faster growth and lower risk typically justifying a higher multiple.
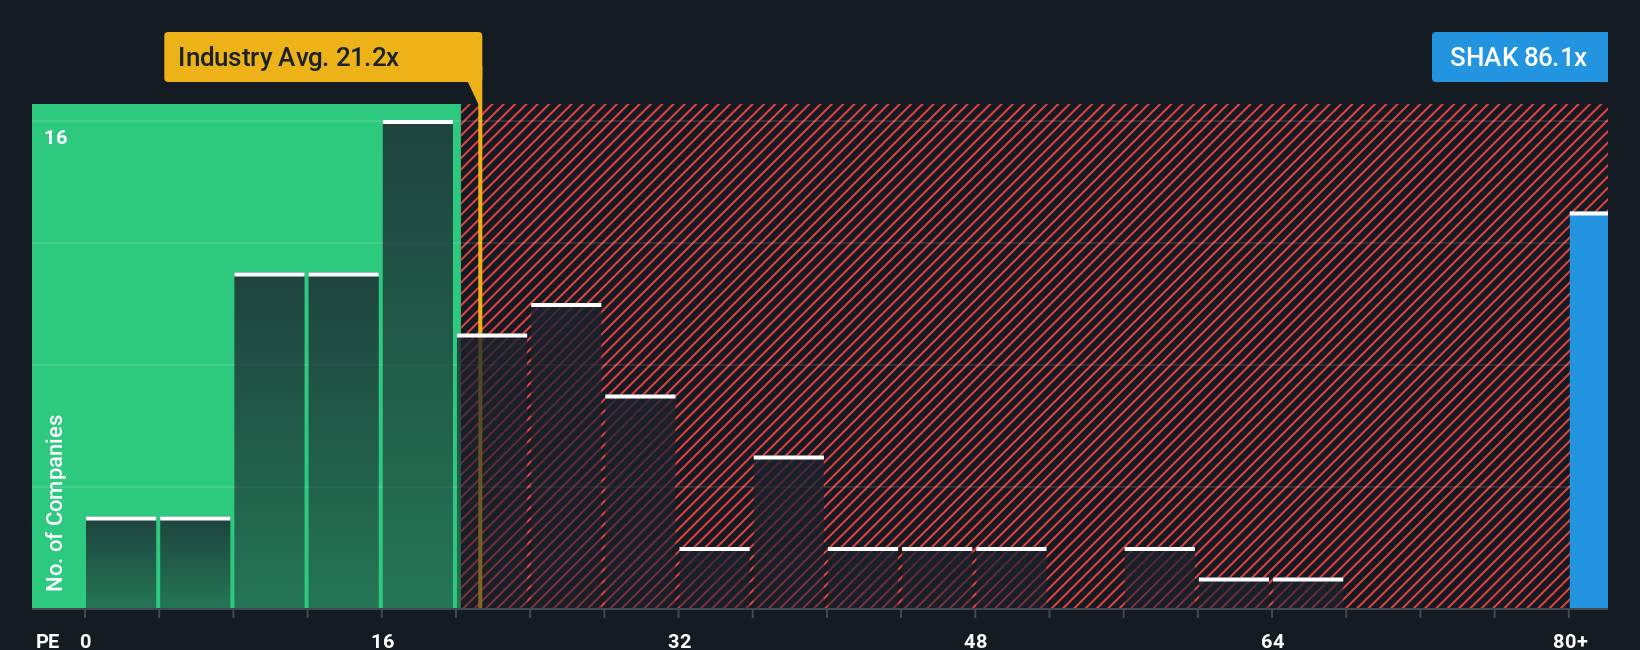
Shake Shack currently trades on a PE of about 78.6x, which is far richer than both the Hospitality industry average of roughly 24.6x and the broader peer group near 28.1x. To move beyond those blunt comparisons, Simply Wall St calculates a Fair Ratio, an estimate of the PE multiple that would be appropriate for Shake Shack given its specific combination of earnings growth potential, profit margins, industry positioning, market cap and company specific risks. This makes the Fair Ratio a more tailored yardstick than simple industry or peer averages.
Shake Shack’s Fair Ratio is 26.2x, well below its current 78.6x multiple, which suggests that even after accounting for its growth story and risk profile, the market is paying a substantial premium to what our framework considers reasonable.
Result: OVERVALUED
PE ratios tell one story, but what if the real opportunity lies elsewhere? Discover 1445 companies where insiders are betting big on explosive growth.
Upgrade Your Decision Making: Choose your Shake Shack Narrative
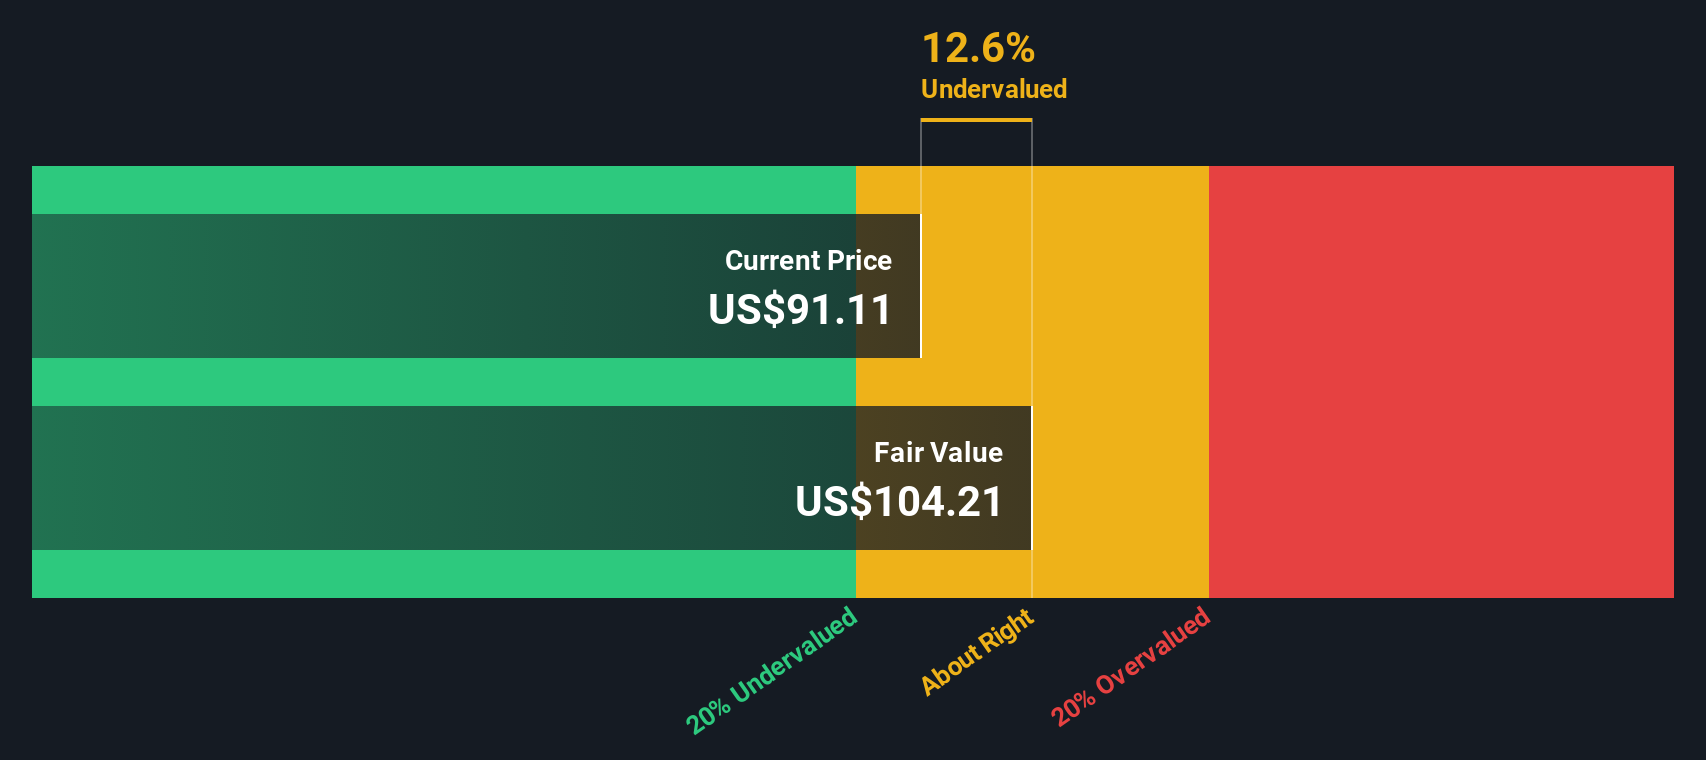
Earlier we mentioned that there is an even better way to understand valuation, so let us introduce you to Narratives, an easy tool on Simply Wall St’s Community page where you connect your story about a company to a set of numbers by choosing your own assumptions for Shake Shack’s future revenue, earnings, and margins. This turns your view into a clear forecast, a Fair Value, and a simple valuation reference by comparing it to the current price. The system updates your Narrative automatically when fresh news or earnings arrive. For example, a more optimistic Shake Shack Narrative might lean toward a Fair Value near $162 if you believe menu innovation, digital upgrades, and global expansion will keep margins climbing. A more cautious Narrative could anchor closer to $110 if you think rising input costs, softer traffic, and operational complexity will cap growth. This gives you a live, structured way to see exactly how your perspective differs from other investors and from the latest analyst consensus around roughly $135 and the platform’s Fair Value near $114.
Do you think there's more to the story for Shake Shack? Head over to our Community to see what others are saying!
This article by Simply Wall St is general in nature. We provide commentary based on historical data and analyst forecasts only using an unbiased methodology and our articles are not intended to be financial advice. It does not constitute a recommendation to buy or sell any stock, and does not take account of your objectives, or your financial situation. We aim to bring you long-term focused analysis driven by fundamental data. Note that our analysis may not factor in the latest price-sensitive company announcements or qualitative material. Simply Wall St has no position in any stocks mentioned.
Have feedback on this article? Concerned about the content? Get in touch with us directly. Alternatively, email editorial-team@simplywallst.com