
 Nasdaq
 华尔街日报
华尔街日报Is Virgin Galactic a Bargain After 46.5% Slide and Delta Fleet Pivot?
- If you have ever wondered whether Virgin Galactic Holdings at $3.24 is a bargain or a value trap, you are not alone. This stock divides opinion like few others in the space tourism theme.
- After a long slide that includes a 24.8% decline over the last week, 11.7% over the past month, and a staggering 46.5% year to date, many investors are asking whether the risk profile has finally shifted enough to justify a fresh look.
- Recent headlines have focused on Virgin Galactic winding down its first generation spaceflight operations to redirect resources into developing its next generation Delta-class spacecraft, aiming for higher flight frequency and better unit economics. At the same time, coverage around funding needs and cash burn has underscored how critical execution on that new fleet will be for long term value.
- On our framework, Virgin Galactic currently scores a 4/6 valuation check, suggesting it appears undervalued on several, but not all, metrics. Next we will walk through what different valuation approaches say about that number and hint at a more powerful way to interpret valuation at the end of this article.
Approach 1: Virgin Galactic Holdings Discounted Cash Flow (DCF) Analysis
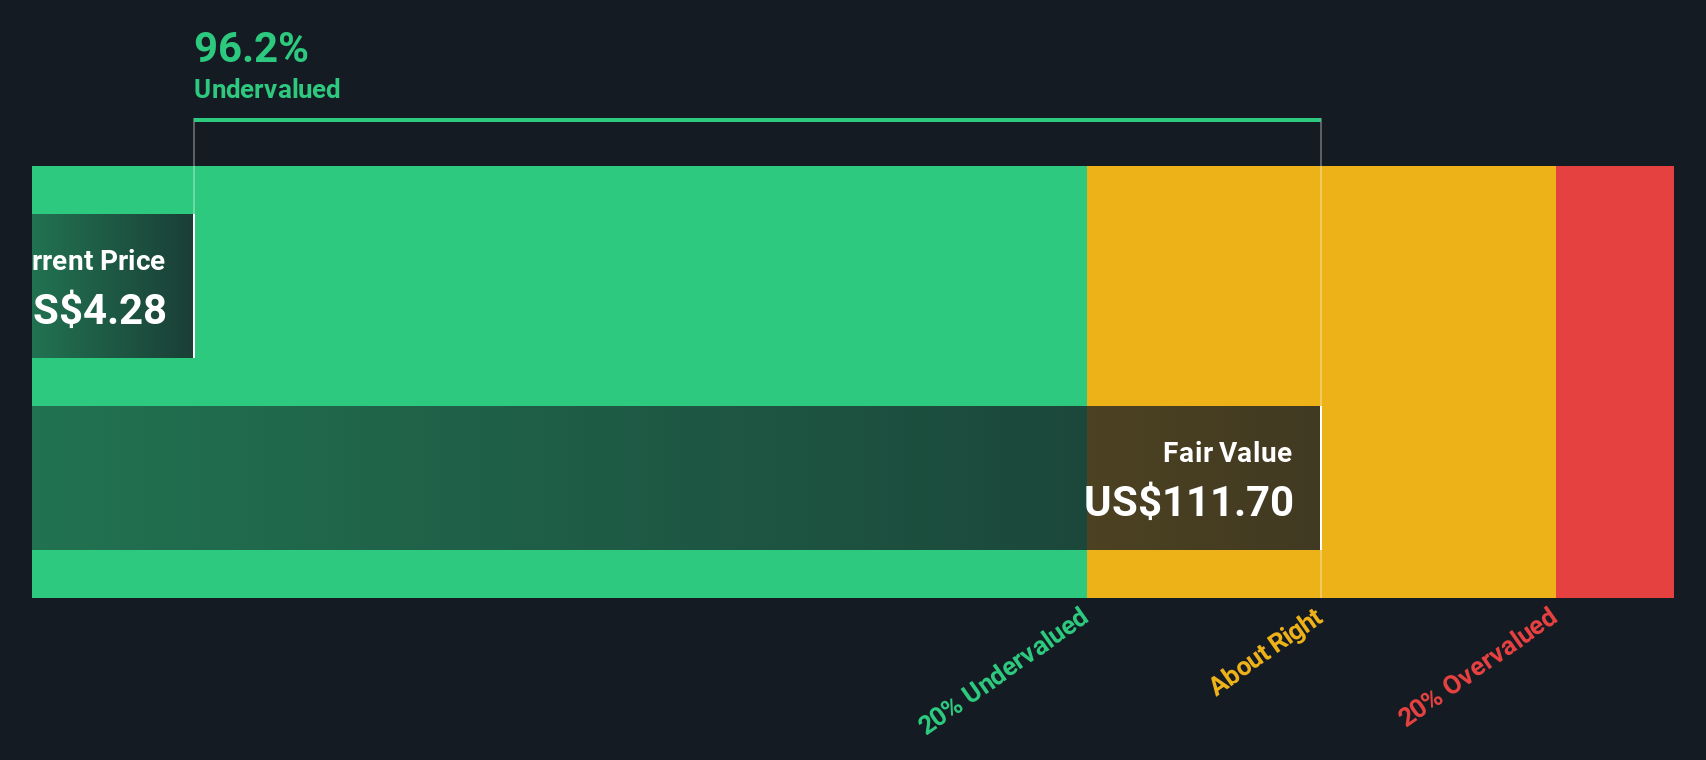
A Discounted Cash Flow model estimates what a company is worth by projecting its future cash flows and then discounting those projections back to today in $ terms. For Virgin Galactic Holdings, the 2 Stage Free Cash Flow to Equity model starts from a last twelve months free cash flow of about $302.7 Million outflow, reflecting heavy investment and ongoing cash burn.
Analysts and extrapolated estimates suggest that cash flows could gradually turn positive and scale meaningfully, with projected free cash flow reaching roughly $972.7 Million by 2035 as the Delta-class fleet ramps up and unit economics improve. Rolling all those projected cash flows together and discounting them back to today produces an estimated intrinsic value of about $77.18 per share.
Compared with the recent share price of roughly $3.24, this estimate implies the stock is trading at about a 95.8% discount to its DCF-based fair value. This indicates that the market is heavily discounting execution and funding risks relative to this optimistic cash flow path.
Result: UNDERVALUED
Our Discounted Cash Flow (DCF) analysis suggests Virgin Galactic Holdings is undervalued by 95.8%. Track this in your watchlist or portfolio, or discover 908 more undervalued stocks based on cash flows.
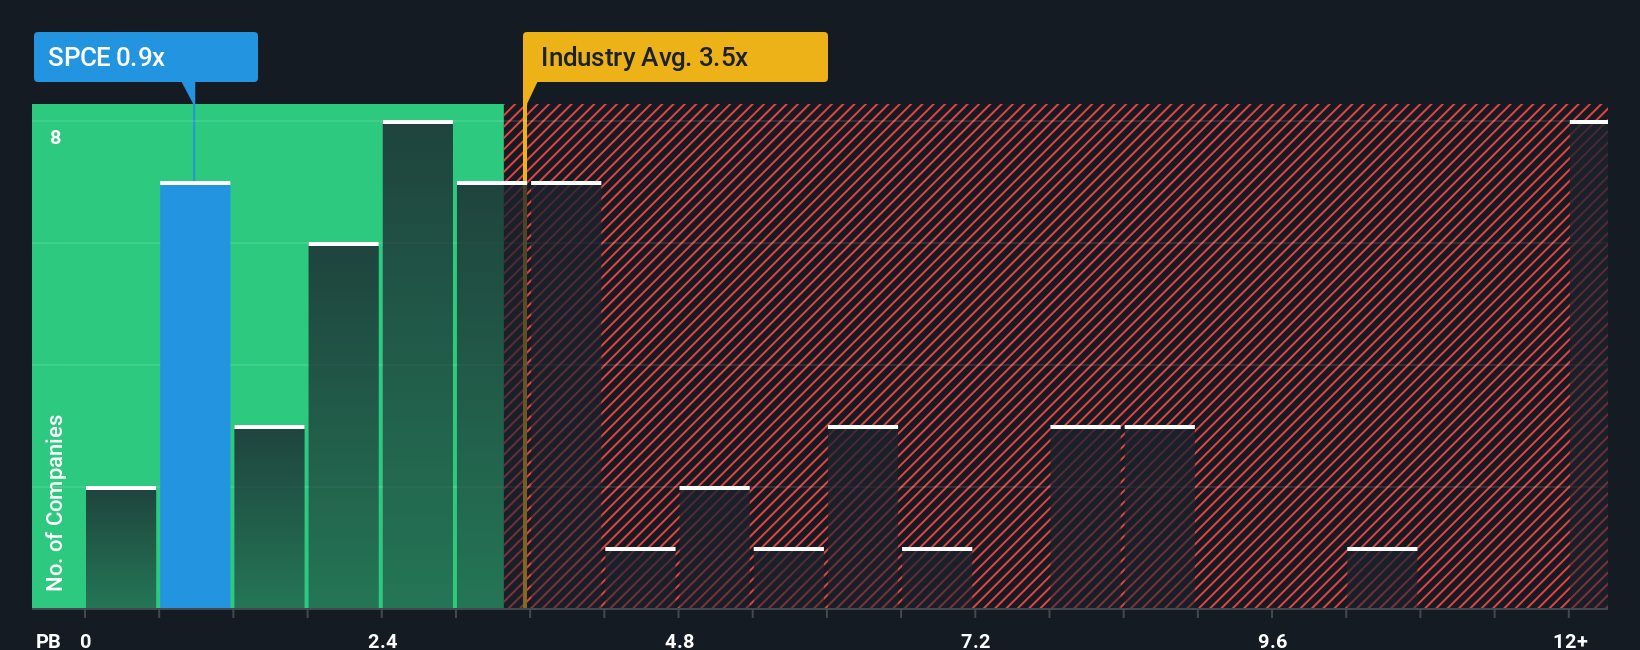
Approach 2: Virgin Galactic Holdings Price vs Book
For asset intensive businesses, the price to book ratio is often a useful sense check, because it compares what the market is paying for a company to the accounting value of the net assets backing it. In general, higher growth prospects and lower perceived risk can justify a richer multiple, while slower growth or elevated risk usually mean investors will demand a discount to book value.
Virgin Galactic currently trades at about 0.91x price to book, which is materially below the Aerospace and Defense industry average of roughly 3.64x and also below the peer group average of around 3.34x. On a simple comparison, that makes the stock look cheap relative to both its sector and direct competitors.
Simply Wall St’s Fair Ratio framework refines this view by estimating the price to book multiple that would be appropriate after factoring in company specific growth potential, profitability profile, size, and risk. This tailored benchmark is more informative than blunt peer or industry comparisons because it adjusts for Virgin Galactic’s unique combination of high uncertainty and long dated growth. On this basis, the stock screens as undervalued, with its current 0.91x multiple sitting comfortably below the Fair Ratio estimate.
Result: UNDERVALUED
PB ratios tell one story, but what if the real opportunity lies elsewhere? Discover 1445 companies where insiders are betting big on explosive growth.
Upgrade Your Decision Making: Choose your Virgin Galactic Holdings Narrative
Earlier we mentioned that there is an even better way to understand valuation, so let us introduce you to Narratives, a simple way to connect your view of Virgin Galactic Holdings story to the numbers that sit behind its fair value. A Narrative is your personal, evidence based storyline for a company, where you spell out what you believe about its future revenue, earnings and margins, and then link that story to a financial forecast and a resulting fair value estimate. On Simply Wall St’s Community page, used by millions of investors, Narratives make this process easy and accessible, so you can quickly see whether your Fair Value suggests the stock is a buy or a sell at today’s Price. Because Narratives are updated dynamically as new information like news, earnings or guidance is released, your valuation stays aligned with reality instead of going stale. For example, one Virgin Galactic Holdings Narrative might assume aggressive fleet ramp up and assign a much higher fair value, while another might focus on financing risk and arrive at a far more conservative number.
Do you think there's more to the story for Virgin Galactic Holdings? Head over to our Community to see what others are saying!
This article by Simply Wall St is general in nature. We provide commentary based on historical data and analyst forecasts only using an unbiased methodology and our articles are not intended to be financial advice. It does not constitute a recommendation to buy or sell any stock, and does not take account of your objectives, or your financial situation. We aim to bring you long-term focused analysis driven by fundamental data. Note that our analysis may not factor in the latest price-sensitive company announcements or qualitative material. Simply Wall St has no position in any stocks mentioned.
Have feedback on this article? Concerned about the content? Get in touch with us directly. Alternatively, email editorial-team@simplywallst.com