
 Nasdaq
 华尔街日报
华尔街日报Has Ford’s 42.6% Rally Fully Priced In Its EV Push and Truck Strength?
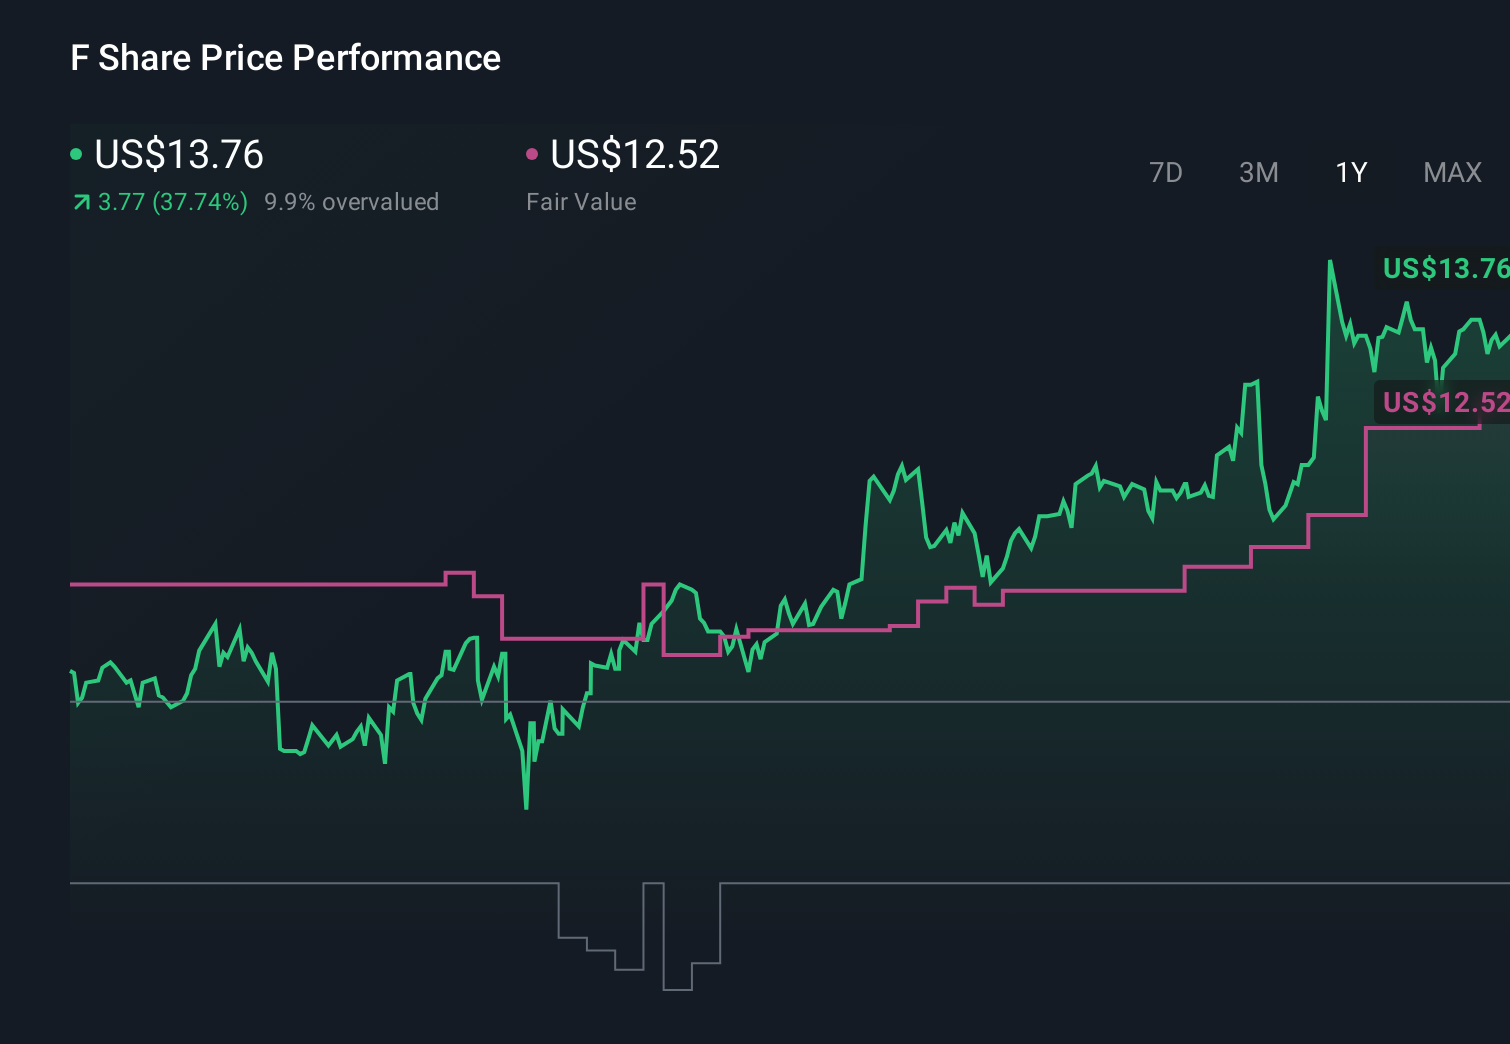
- Wondering if Ford Motor at around $13.76 is still a value play or if the easy money has already been made? This article will walk you through what the numbers are really saying about the stock.
- Ford shares have climbed 5.6% over the last week, 4.3% over the past month, and are up 42.6% year to date. This naturally raises the question of whether the market is re-rating the stock or getting ahead of itself.
- Recent headlines have focused on Ford doubling down on its electric and hybrid strategy while still leaning on its profitable truck and SUV lineup. This includes fresh attention on the F 150 and Super Duty franchises as pillars of its cash generation. At the same time, updates around EV partnerships, battery investments, and labor cost pressures have all shaped how investors are thinking about Ford's long term profitability and risk profile.
- On our framework, Ford currently scores 3/6 on valuation, suggesting it looks undervalued on some metrics but not across the board. Next, we will break down what each approach is telling us about the stock's fair value and why there might be an even better way to think about valuation by the end of this article.
Approach 1: Ford Motor Discounted Cash Flow (DCF) Analysis
A Discounted Cash Flow model estimates what a company is worth by projecting the cash it can generate in the future and then discounting those cash flows back to what they are worth in $ today.
For Ford Motor, the model starts with trailing twelve month free cash flow of about $11.7 billion. Analysts provide explicit forecasts for the next few years. Beyond that, Simply Wall St extrapolates the trend. Under this two stage Free Cash Flow to Equity approach, Ford’s free cash flow is projected to be around $4.7 billion in 2035, implying a gradual decline from today’s elevated levels as the business normalizes and investment needs stay high.
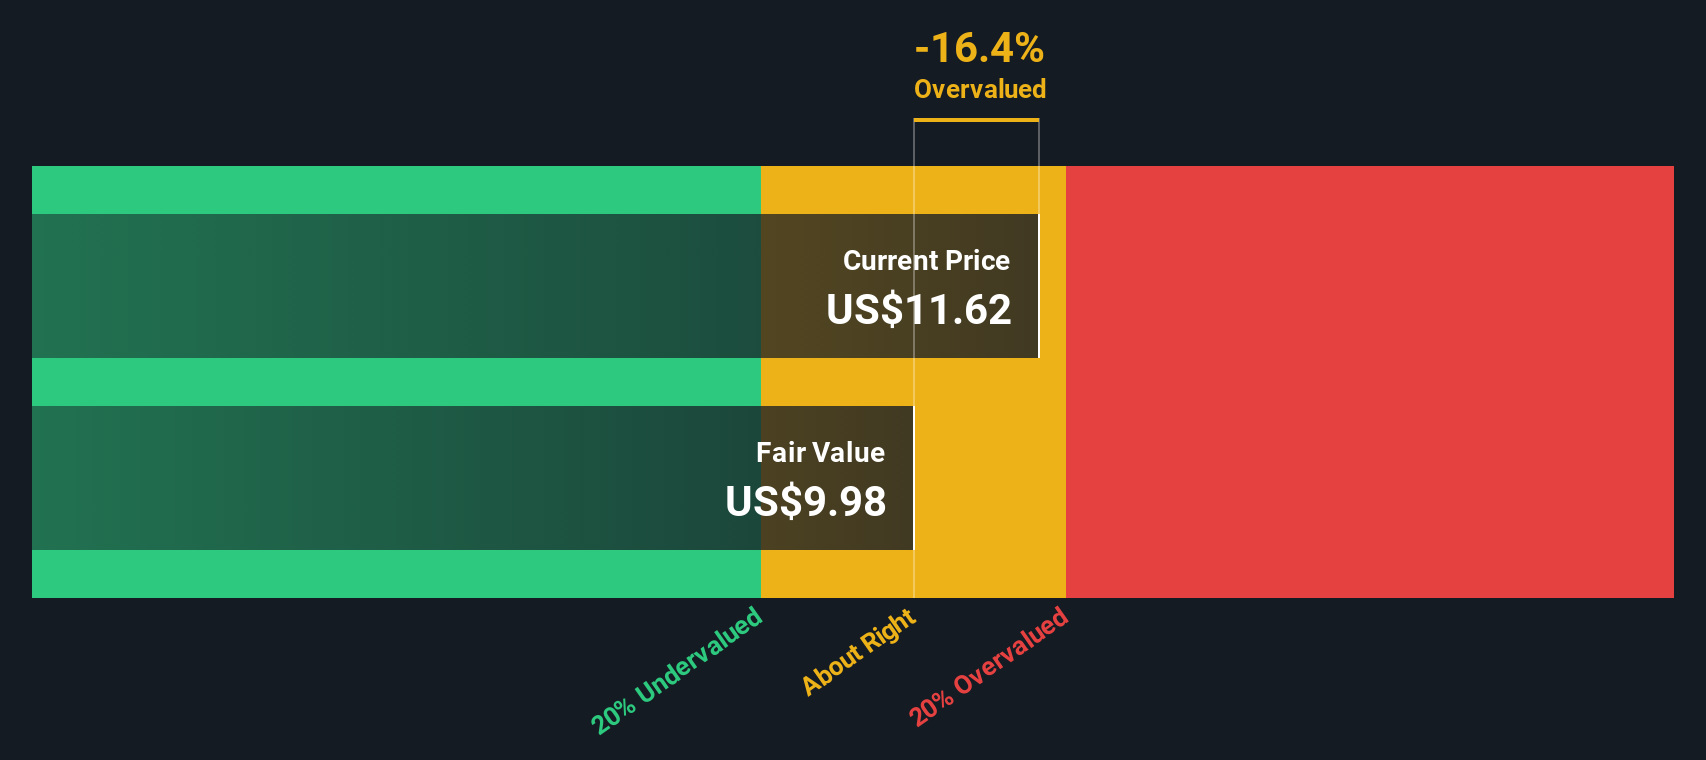
When all those projected cash flows are discounted back, the DCF model arrives at an intrinsic value of roughly $11.69 per share. Compared with the current share price of about $13.76, the model suggests the stock is around 17.7% overvalued. This indicates that the market is already pricing in more optimism than the cash flow projections support.
Result: OVERVALUED
Our Discounted Cash Flow (DCF) analysis suggests Ford Motor may be overvalued by 17.7%. Discover 908 undervalued stocks or create your own screener to find better value opportunities.
Approach 2: Ford Motor Price vs Earnings
For a profitable company like Ford, the price to earnings, or PE, ratio is a useful way to gauge how much investors are paying for each dollar of current profits. What counts as a reasonable PE will usually rise when the market expects stronger, more reliable growth, and fall when earnings are cyclical or perceived as risky.
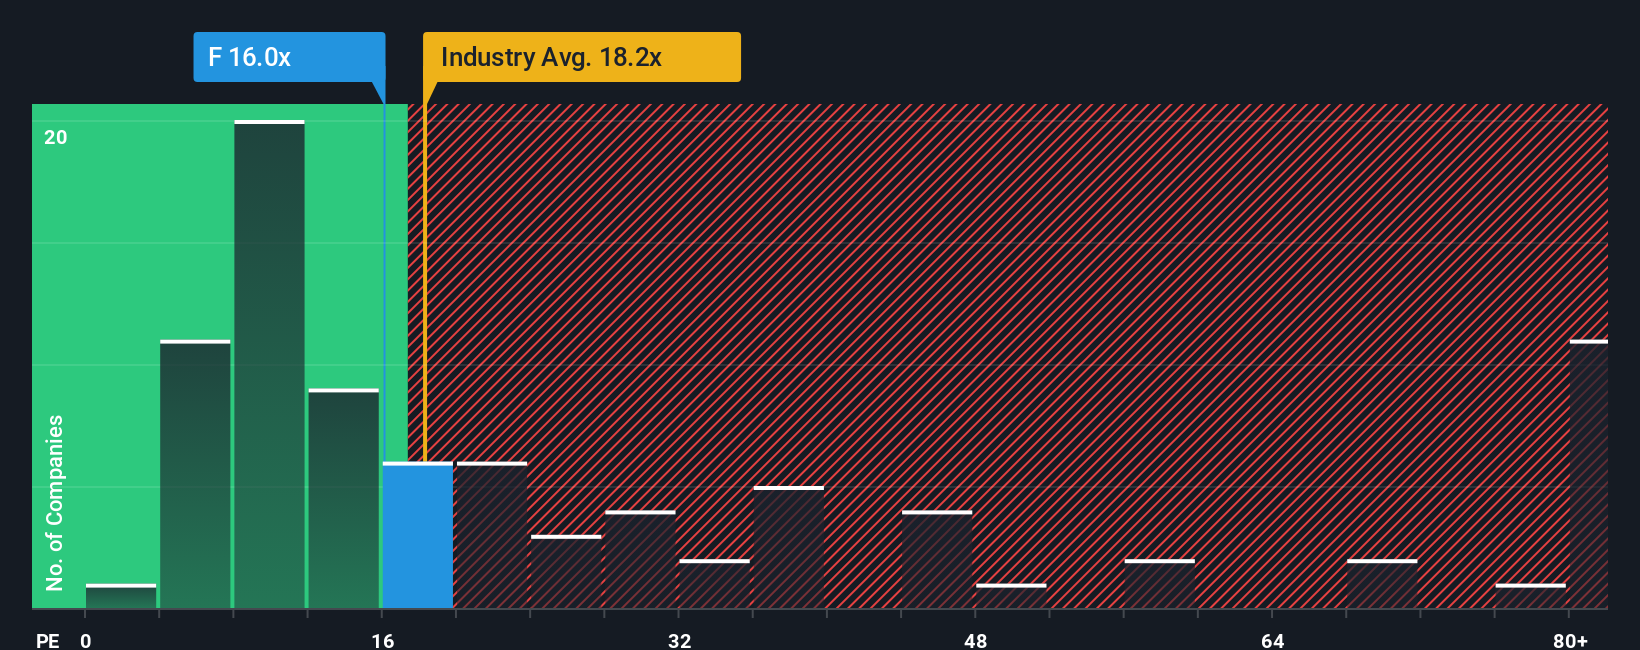
Ford currently trades on a PE of about 11.7x, which is well below both the Auto industry average of roughly 18.7x and the broader peer group closer to 26.1x. At first glance, that discount suggests the market is assigning a caution premium to Ford relative to other automakers and related names.
Simply Wall St’s Fair Ratio framework goes a step further by estimating what Ford’s PE should be once its specific earnings growth outlook, margins, industry position, market cap, and risk factors are all taken into account. On this basis, Ford’s Fair Ratio is around 19.2x, indicating that the shares appear materially cheaper than where they would typically trade given those fundamentals. That points to the stock appearing undervalued on an earnings multiple basis, even after the recent run up.
Result: UNDERVALUED
PE ratios tell one story, but what if the real opportunity lies elsewhere? Discover 1445 companies where insiders are betting big on explosive growth.
Upgrade Your Decision Making: Choose your Ford Motor Narrative
Earlier we mentioned that there is an even better way to understand valuation. Let us introduce you to Narratives, an easy tool on Simply Wall St’s Community page that lets you connect your view of Ford’s story to your own forecast for its future revenues, earnings and margins, and then to a personal fair value estimate you can directly compare with today’s share price to inform your decision. It updates dynamically as new news or earnings arrive. For example, a bullish investor who believes Ford’s connected services and cost cuts will drive margins higher and justify something closer to the top analyst target of about $16.00 may choose to hold or add. In contrast, a more cautious investor who is focused on EV losses, aluminum supply risks and slower revenue growth may anchor nearer the low end around $8.00 and perhaps wait for a more attractive entry price. Both investors are using the same data but telling different, clearly quantified stories.
Do you think there's more to the story for Ford Motor? Head over to our Community to see what others are saying!
This article by Simply Wall St is general in nature. We provide commentary based on historical data and analyst forecasts only using an unbiased methodology and our articles are not intended to be financial advice. It does not constitute a recommendation to buy or sell any stock, and does not take account of your objectives, or your financial situation. We aim to bring you long-term focused analysis driven by fundamental data. Note that our analysis may not factor in the latest price-sensitive company announcements or qualitative material. Simply Wall St has no position in any stocks mentioned.
Have feedback on this article? Concerned about the content? Get in touch with us directly. Alternatively, email editorial-team@simplywallst.com