
 Nasdaq
 华尔街日报
华尔街日报Is It Too Late To Consider Barrick After Its 170% Surge In 2025?
- If you are wondering whether Barrick Mining is still a smart buy after its recent run, or if the easy money has already been made, you are in the right place to unpack what the current price really implies.
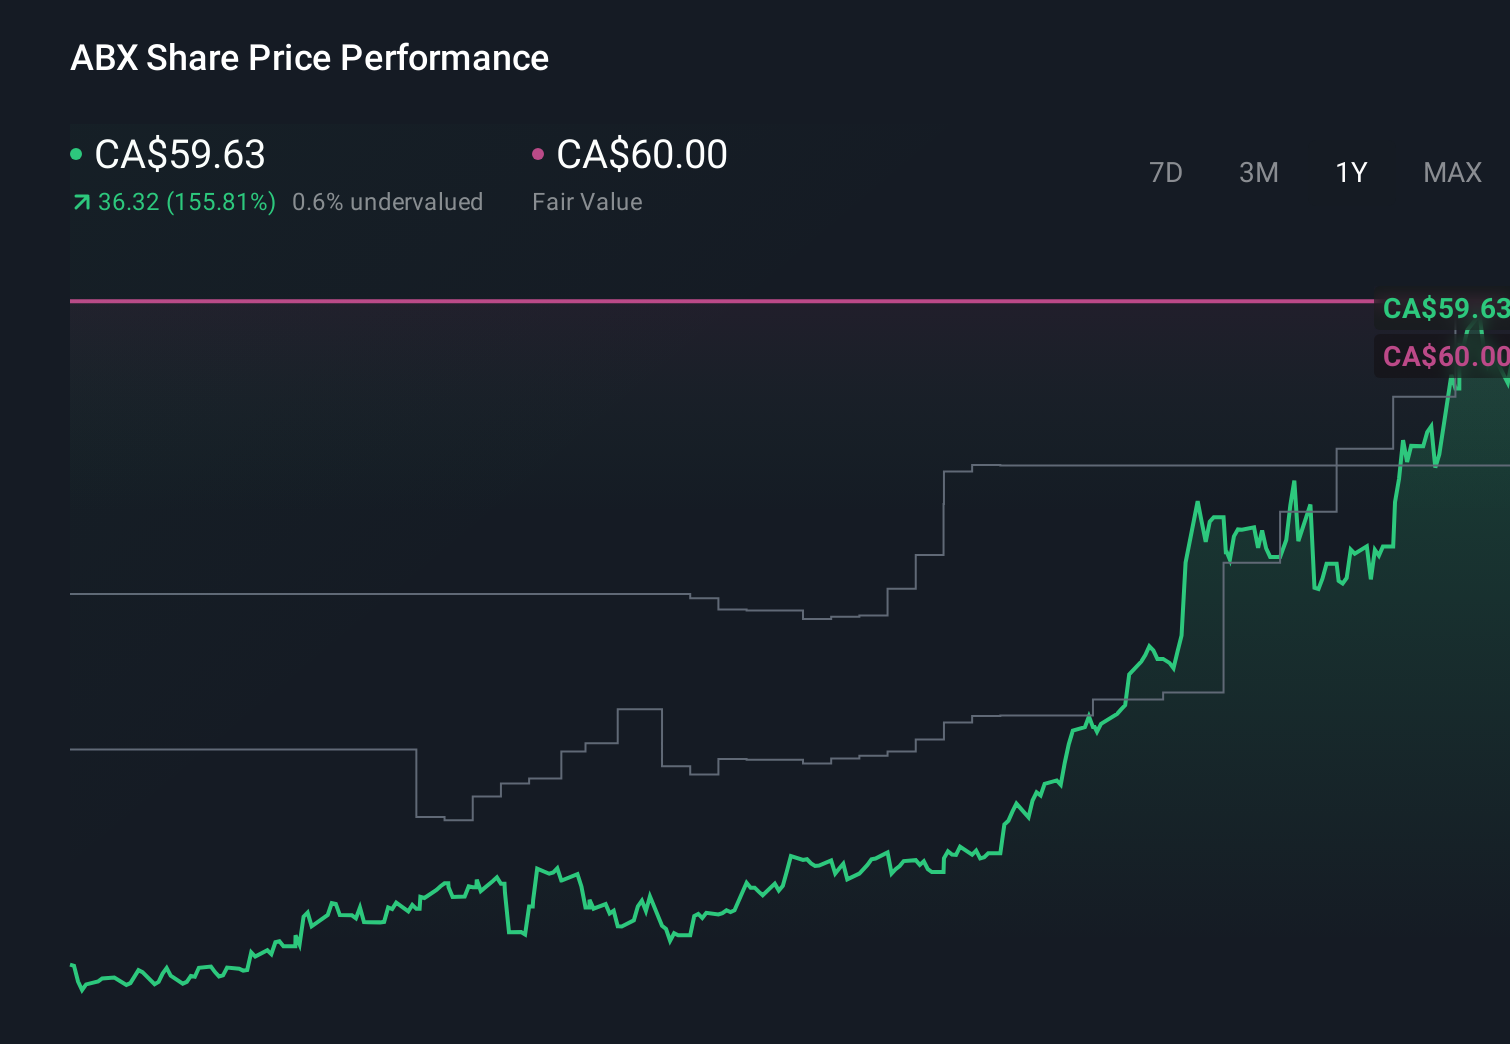
- The stock has been on a tear, with the share price up 5.0% over the last week, 16.4% over the last month, and 169.8% year to date, reshaping how the market is thinking about its growth and risk profile.
- Much of this momentum has been driven by a sharper focus on gold and copper supply constraints, alongside renewed investor interest in miners as a hedge against inflation and geopolitical uncertainty. Headlines around tightening metal markets and rising long term demand expectations have helped investors re rate names like Barrick as strategic assets rather than just cyclical plays.
- Despite that surge, Barrick Mining scores a solid 5/6 on our valuation checks, suggesting the market may still be underestimating parts of the story. Next, we will walk through the main valuation approaches investors use, then finish with a more nuanced way to think about what the stock is really worth.
Approach 1: Barrick Mining Discounted Cash Flow (DCF) Analysis
A Discounted Cash Flow model estimates what a company is worth today by projecting the cash it can generate in the future and discounting those cash flows back to the present. For Barrick Mining, this involves taking its current Free Cash Flow of roughly $2.57 billion and applying a two-stage growth profile built from analyst estimates and extrapolations.
Analysts project Barrick’s Free Cash Flow to increase over the coming decade, with estimates reaching around $13.72 billion by 2035. Simply Wall St uses detailed analyst forecasts for the earlier years, then extends those trends further out to build a long-term picture of the company’s earning power. These cash flows are then discounted to reflect risk and the time value of money.
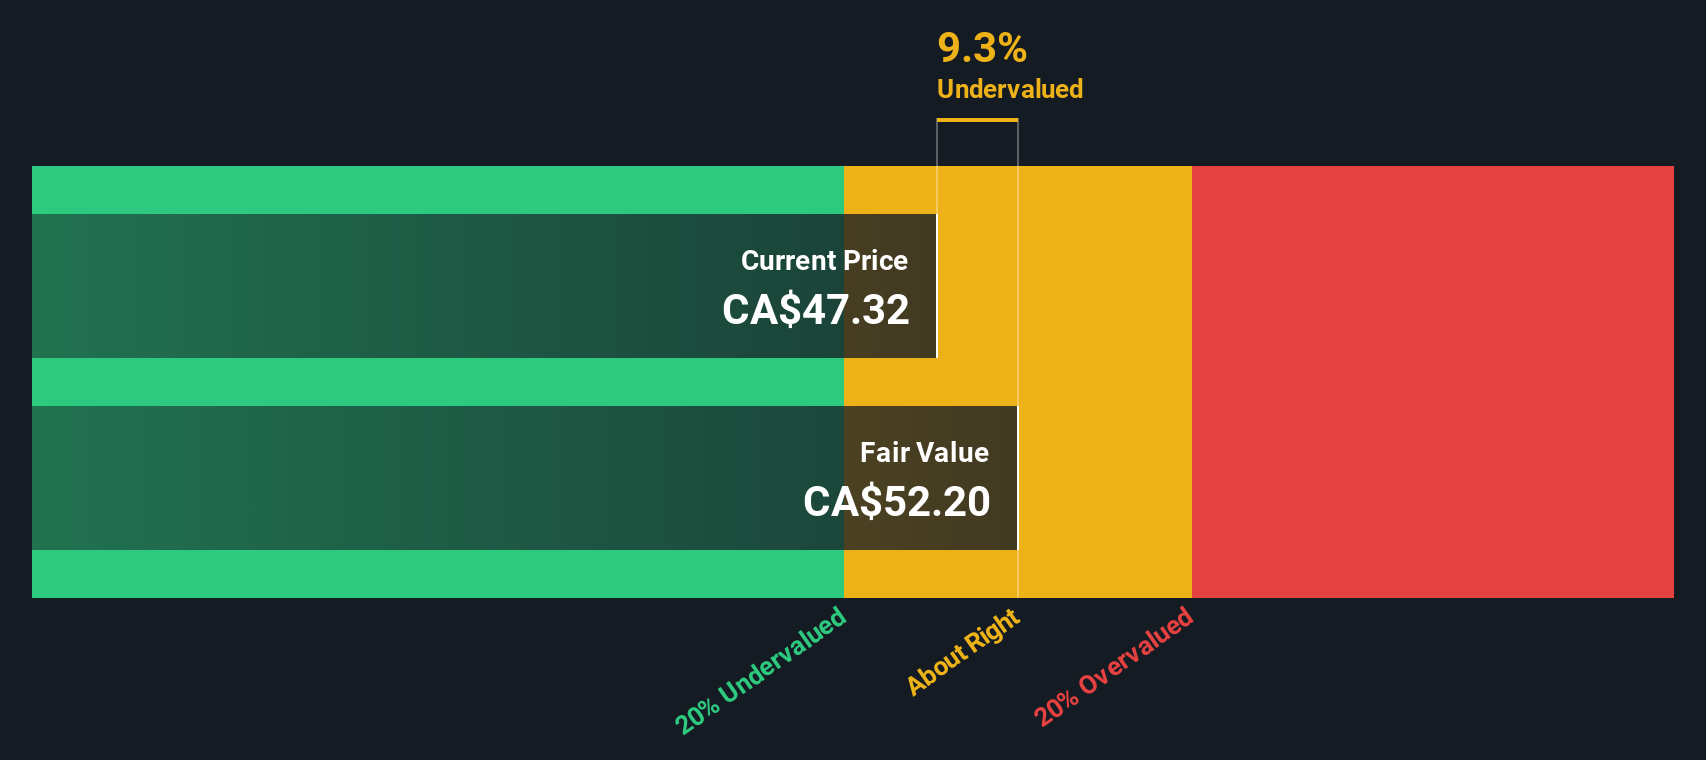
On this basis, the DCF model arrives at an intrinsic value of about $124.73 per share, which implies the stock is roughly 65.5% undervalued relative to its current market price. This indicates that the market may still be pricing Barrick more like a cyclical miner rather than a cash-generating franchise.
Result: UNDERVALUED
Our Discounted Cash Flow (DCF) analysis suggests Barrick Mining is undervalued by 65.5%. Track this in your watchlist or portfolio, or discover 908 more undervalued stocks based on cash flows.
Approach 2: Barrick Mining Price vs Earnings
For a profitable miner like Barrick, the Price to Earnings ratio is a straightforward way to gauge how much investors are paying for each dollar of current earnings. In general, companies with stronger, more reliable growth and lower perceived risk can justify a higher PE, while those with slower growth or higher risk should trade on a lower multiple.
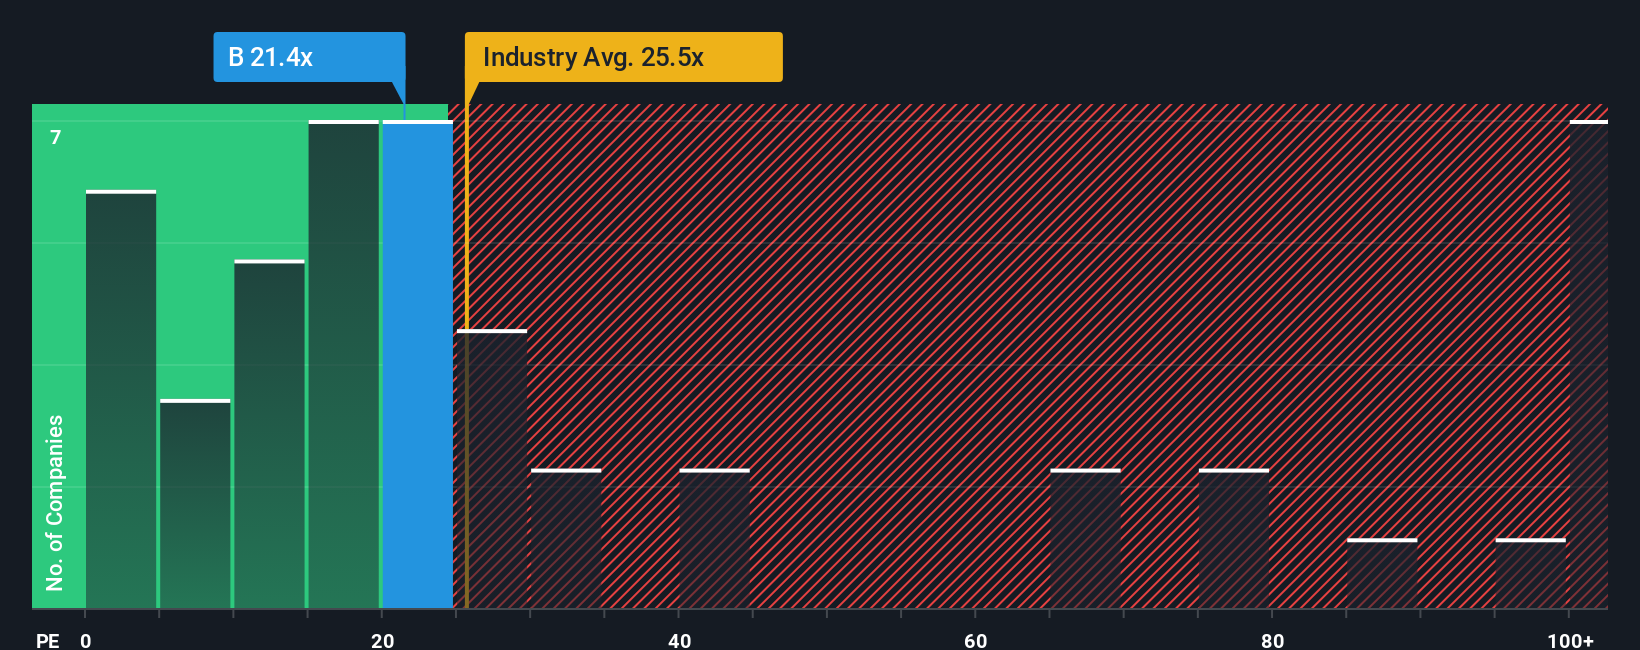
Barrick currently trades on a PE of about 20.3x, below both the Metals and Mining industry average of roughly 24.5x and the peer group average of around 24.1x. Simply Wall St’s Fair Ratio framework goes a step further by estimating what PE Barrick could trade on, given its earnings growth outlook, margins, industry, market cap and risk profile, arriving at a Fair Ratio of about 26.8x. Because this incorporates company specific drivers rather than just broad group averages, it provides a more tailored view of what “fair value” looks like for Barrick.
Comparing the current 20.3x PE to the 26.8x Fair Ratio suggests the market is still discounting Barrick’s earnings power and resilience.
Result: UNDERVALUED
PE ratios tell one story, but what if the real opportunity lies elsewhere? Discover 1445 companies where insiders are betting big on explosive growth.
Upgrade Your Decision Making: Choose your Barrick Mining Narrative
Earlier we mentioned that there is an even better way to understand valuation, so let us introduce you to Narratives. This is a simple framework on Simply Wall St’s Community page where you write the story behind your numbers by laying out your view of a company’s future revenue, earnings and margins. You then link that story to a financial forecast and then to a Fair Value you can compare with the current price to decide whether to buy, hold or sell. The platform keeps your Narrative updated as new data, news or earnings arrive. For example, one Barrick Mining investor might build a bullish Narrative around a commodity super-cycle, 4.5 percent annual revenue growth and 15 percent profit margins that supports a Fair Value well above today’s price. Another, more cautious investor might focus on geopolitical and environmental risks, assume slower growth and lower margins, and therefore arrive at a Fair Value that signals the stock is closer to fully valued.
Do you think there's more to the story for Barrick Mining? Head over to our Community to see what others are saying!
This article by Simply Wall St is general in nature. We provide commentary based on historical data and analyst forecasts only using an unbiased methodology and our articles are not intended to be financial advice. It does not constitute a recommendation to buy or sell any stock, and does not take account of your objectives, or your financial situation. We aim to bring you long-term focused analysis driven by fundamental data. Note that our analysis may not factor in the latest price-sensitive company announcements or qualitative material. Simply Wall St has no position in any stocks mentioned.
Have feedback on this article? Concerned about the content? Get in touch with us directly. Alternatively, email editorial-team@simplywallst.com